
Summer Sales Spike: What the New Data Says About Seattle/Eastside Housing
Inventory is up 41.5% and pendings are climbing—smart buyers and sellers are making moves now
More inventory → less buyer urgency, more choice
Turning Headwinds into Tailwinds
Clearer policy direction after July’s omnibus bill
Corporate momentum (MSFT/Azure & 365, AMZN/AWS & retail, Boeing deliveries improving)
Equities testing highs, boosting confidence
AI hiring offsets part of the layoff narrative
What the Chart Shows (Apr 2024 → Jun 2025)
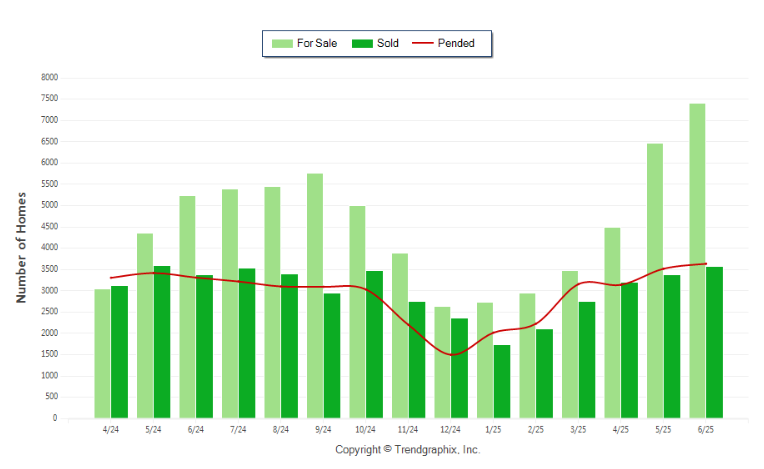
How to read it
Light-green bars (For Sale): Listings swelled through summer ’24, fell into December, then surged again in spring ’25—reaching ~7,400 in June.
Dark-green bars (Sold): Closings followed a classic pattern—summer strength, Q4 lull, spring rebound—ending June near 3,565.
Red line (Pended): New contracts bottomed in December and climbed into mid-’25, finishing June around 3,638.
Takeaway: Supply grew faster than demand. Expect moderating price pressure even as activity improves.
Current Stats You Can Use

June ’25 vs. May ’25 (MoM)
For Sale: 6,475 → 7,400 (+14.3%)
Sold: 3,377 → 3,565 (+5.6%)
Pended: 3,520 → 3,638 (+3.4%)
June ’25 vs. June ’24 (YoY)
For Sale: +41.5% (7,400 vs. 5,228)
Sold: +5.4% (3,565 vs. 3,381)
Pended: +9.8% (3,638 vs. 3,313)
July 1–28, ’25 vs. June 1–28, ’25 (MTD MoM)
For Sale: –1.5% (7,384 vs. 7,496)
Sold: –9.4% (2,965 vs. 3,274)
Pended: –2.3% (3,246 vs. 3,322)
July 1–28, ’25 vs. July 1–28, ’24 (MTD YoY)
For Sale: +37.2% (7,384 vs. 5,382)
Sold: –1.8% (2,965 vs. 3,020)
Pended: +12.9% (3,246 vs. 2,876)
YTD ’25 vs. YTD ’24
Sold: +2.3% (19,756 vs. 19,319)
Pended: +4.7% (20,885 vs. 19,944)
What it means:
Buyers have far more choice (inventory up 37–42% YoY), easing bidding pressure.
Pendings are up solidly YoY, signaling renewed demand despite the larger supply.
Closings are steady to slightly higher YTD—transactions are happening, but with more negotiation room.
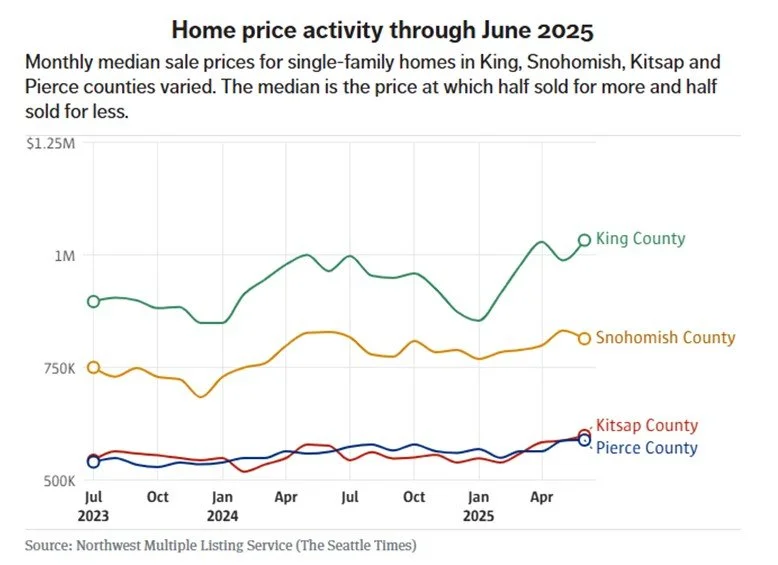
King County Pulse - Seattle Times
As highlighted by The Seattle Times (7/5/25), the market showed a May dip with June recovery—consistent with the visuals above.
Seattle Times - sales are slowing down
What to Do Now
If you’re selling
Price to the market you have, not the one you wish you had.
Elevate presentation (staging, film, targeted digital).
Expect more showings, longer days on market, and sharper negotiations.
If you’re buying
Use the inventory surge to compare options and negotiate terms.
Lock a rate now and refi later if cuts land in the fall.
Target homes with longer market times for concession opportunities.

Let’s Talk Strategy
Curious how these shifts affect your home or purchase plan? Request a complimentary market evaluation or a custom buyer game plan—I’ll map your next best move, step by step.
[Sources: Trendgraphix, Inc. (visuals shown); S&P/Case-Shiller; local MLS data; Seattle Times (7/5/25). Images © their respective owners]