

Discover the 2024 Waterfront Real Estate Market Trends in Greater Seattle
If you've ever flown home to Seattle on a clear day, you're familiar with the enchanting view as you approach the airport. A mosaic of waterways spreads out below you, from the sparkling vastness of Puget Sound to the shores of Lake Washington, dotted with docks. Water defines our Pacific Northwest life, whether we’re swimming, boating, fishing, paddling, or simply taking in the view. Those fortunate enough to own a home along one of our region’s coveted shorelines recognize the sublime pleasures of such a rare opportunity.
Whether you are planning to sell a waterfront home or looking to buy one, our 2024 Waterfront Report offers a detailed analysis of total sales and new listings month by month to guide your real estate journey. Here, we provide a five-year seasonal view of home listing and selling trends across Washington’s most sought-after waterfront counties, from Kitsap to King, and Skagit to San Juan. Dive into the data and discover the market trends.
2024 Waterfront County Report
〰️
2024 Waterfront County Report 〰️

King County
2024 Waterfront Report
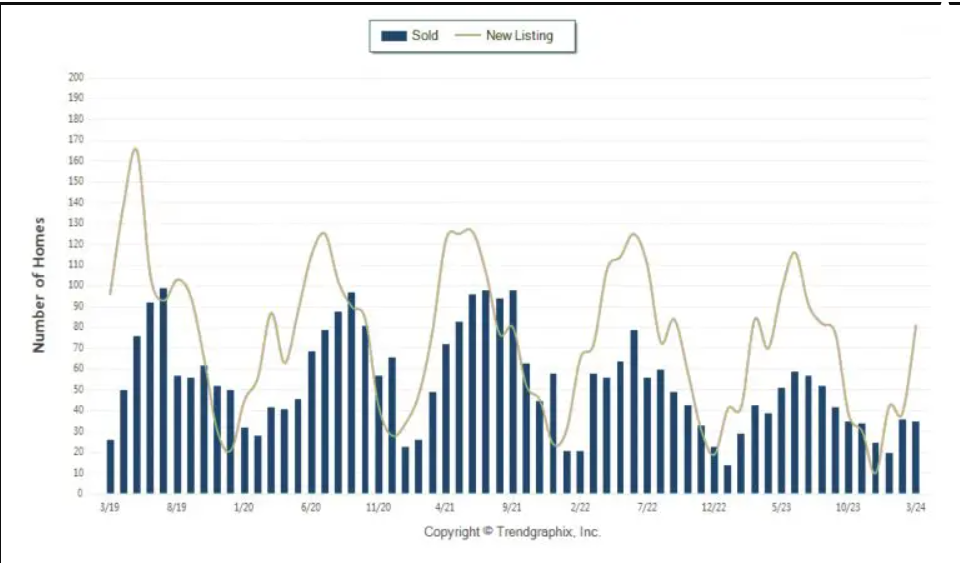
New Listings and Sales Trends: Over the past five years, new waterfront listings in King County peaked in 2019 but have since stabilized. There is a notable decrease in listings during the colder months, with activity picking up significantly in spring and summer.
2023 Data:
352 residential waterfront home sales
Median sales price: $1.662M
Waterfront sales accounted for 2% of all residential sales
Pierce County
2024 Waterfront Report

New Listings and Sales Trends: Pierce County saw fewer new waterfront listings in 2023 compared to previous years, reflecting broader regional inventory challenges. Despite lower closed sales overall, there was a notable spike in October 2023.
2023 Data:
241 residential waterfront home sales
Median sales price: $1.1M
Waterfront sales accounted for 3% of all residential sales
Snohomish County
2024 Waterfront Report

New Listings and Sales Trends: Snohomish County experienced peaks in new listings in June and July, with closed sales peaking in August, aligning with typical seasonal patterns.
2023 Data:
175 residential waterfront home sales
Median sales price: $727K
Waterfront sales accounted for 2% of all residential sales
Kitsap County
2024 Waterfront Report

New Listings and Sales Trends: Kitsap County, home to major waterfront locales like Bainbridge Island and Bremerton, typically sees peaks in closed sales during late summer and early fall. In 2023, sales trends were steadier with fewer fluctuations from July to October.
2023 Data:
188 residential waterfront home sales
Median sales price: $1.117M
Waterfront sales accounted for 5% of all residential sales
Clallam County
2024 Waterfront Report

New Listings and Sales Trends: Clallam County saw a market slowdown at the end of 2022 but rebounded in spring 2023, though not reaching previous years' levels. Peaks in new listings and sales occurred in May 2023.
2023 Data:
28 waterfront home sales
Median sales price: $693K
Waterfront sales accounted for 3% of all residential sales
Islands County
2024 Waterfront Report

New Listings and Sales Trends: Island County's new listings hit their lowest point in December, consistently peaking in spring over the past few years. Closed sales remained consistent through summer into early autumn in 2023.
2023 Data:
134 waterfront home sales
Median sales price: $1.087M
Waterfront sales accounted for 11% of all residential sales
Skagit County
2024 Waterfront Report

New Listings and Sales Trends: In Skagit County, closed sales picked up in spring and continued through summer, with new listings peaking in summer. Listings hit a low in December, reflecting a seasonal pause.
2023 Data:
68 waterfront home sales
Median sales price: $814K
Waterfront sales accounted for 5% of all residential sales
Grays Harbor County
2024 Waterfront Report

New Listings and Sales Trends: Sellers in Grays Harbor waited until warmer months to list their homes, with new listings peaking in June. Closed sales increased gradually from June to September.
2023 Data:
98 waterfront home sales
Median sales price: $517K
Waterfront sales accounted for 8% of all residential sales
Jefferson County
2024 Waterfront Report

New Listings and Sales Trends: The waterfront market in Jefferson County showed unpredictable trends, with new listings peaking in spring 2023. Closed sales followed no clear pattern, with multiple spikes in different months.
2023 Data:
51 waterfront home sales
Median sales price: $895K
Waterfront sales accounted for 11% of all residential sales
Pacific County
2024 Waterfront Report

New Listings and Sales Trends: Pacific County did not follow typical seasonal trends. In 2023, closings picked up in spring and peaked in May and June, with July showing the lowest number of closings.
2023 Data:
48 waterfront home sales
Median sales price: $560K
Waterfront sales accounted for 11% of all residential sales
Embark on Your Waterfront Real Estate Journey with Judah Realty
Whether you're looking to buy or sell a waterfront property in the Greater Seattle area, our detailed market insights can help you make informed decisions. Contact Judah Realty today to begin your journey with experienced professionals who understand the unique allure of Pacific Northwest waterfront living.