

Realogics Sotheby's International Realty · 2025 Data
Eastside Waterfront
Market Reports
In 2024, only 3.6% of all single-family homes sold across the Puget Sound region were waterfront properties. This is the definitive data resource for buyers and sellers navigating the Pacific Northwest's most scarce and consequential real estate market.
Home › Market Reports › Waterfront Market Reports
Current Report
2025 Realogics Sotheby's International Realty
Waterfront Report
The 2025 Waterfront Report from Realogics Sotheby's International Realty covers 16 distinct communities across 12 counties, providing year-over-year analysis of median sales price, average frontage, days on market, and closed sales volume — the most comprehensive waterfront data set available in the Pacific Northwest.
From Mercer Island's record-setting $8.11M median to Lake Sammamish's family-accessible entry points, this report is the foundation of every waterfront purchase and sale strategy I build with my clients.
2025 Report at a Glance
16
Communities Analyzed
3.6%
of homes sold were waterfront
$8.11M
Highest median — Mercer Island
12
Counties Covered
2025 Data — All Eastside Markets
Waterfront Market Comparison at a Glance
Source: 2025 Realogics Sotheby's International Realty Waterfront Report · All figures reflect 2024 closed sales
| Market | Median Price | Avg Frontage | Days on Market | Price Range | Explore |
|---|---|---|---|---|---|
|
Mercer Island
Lake Washington · Island privacy |
$8,112,500 | 101 ft | 159 days | $3M – $28.5M+ | View Page → |
|
Kirkland
Lake Washington · Urban walkability |
$6,300,000 | 71 ft | 63 days | $2M – $20M+ | View Page → |
|
Bellevue
Lake Washington · Downtown access |
$3,860,000 | 72 ft | 72 days | $2M – $50M+ | View Page → |
|
Lake Sammamish
Lake Sammamish · Family swimming |
$3,340,000 | 130 ft | 55 days | $1.5M – $10M+ | View Page → |
|
Issaquah
Lake Sammamish · Tiger Mtn proximity |
$2.5M – $6M | 80–120 ft | 45–75 days | $1.5M – $8M | View Page → |
|
Bainbridge Island
Puget Sound · True island lifestyle |
$2,600,000 | 126 ft | 60–90 days | $1.2M – $12M+ | View Page → |
All data sourced from the 2025 RSIR Waterfront Report. Deemed reliable but not guaranteed.
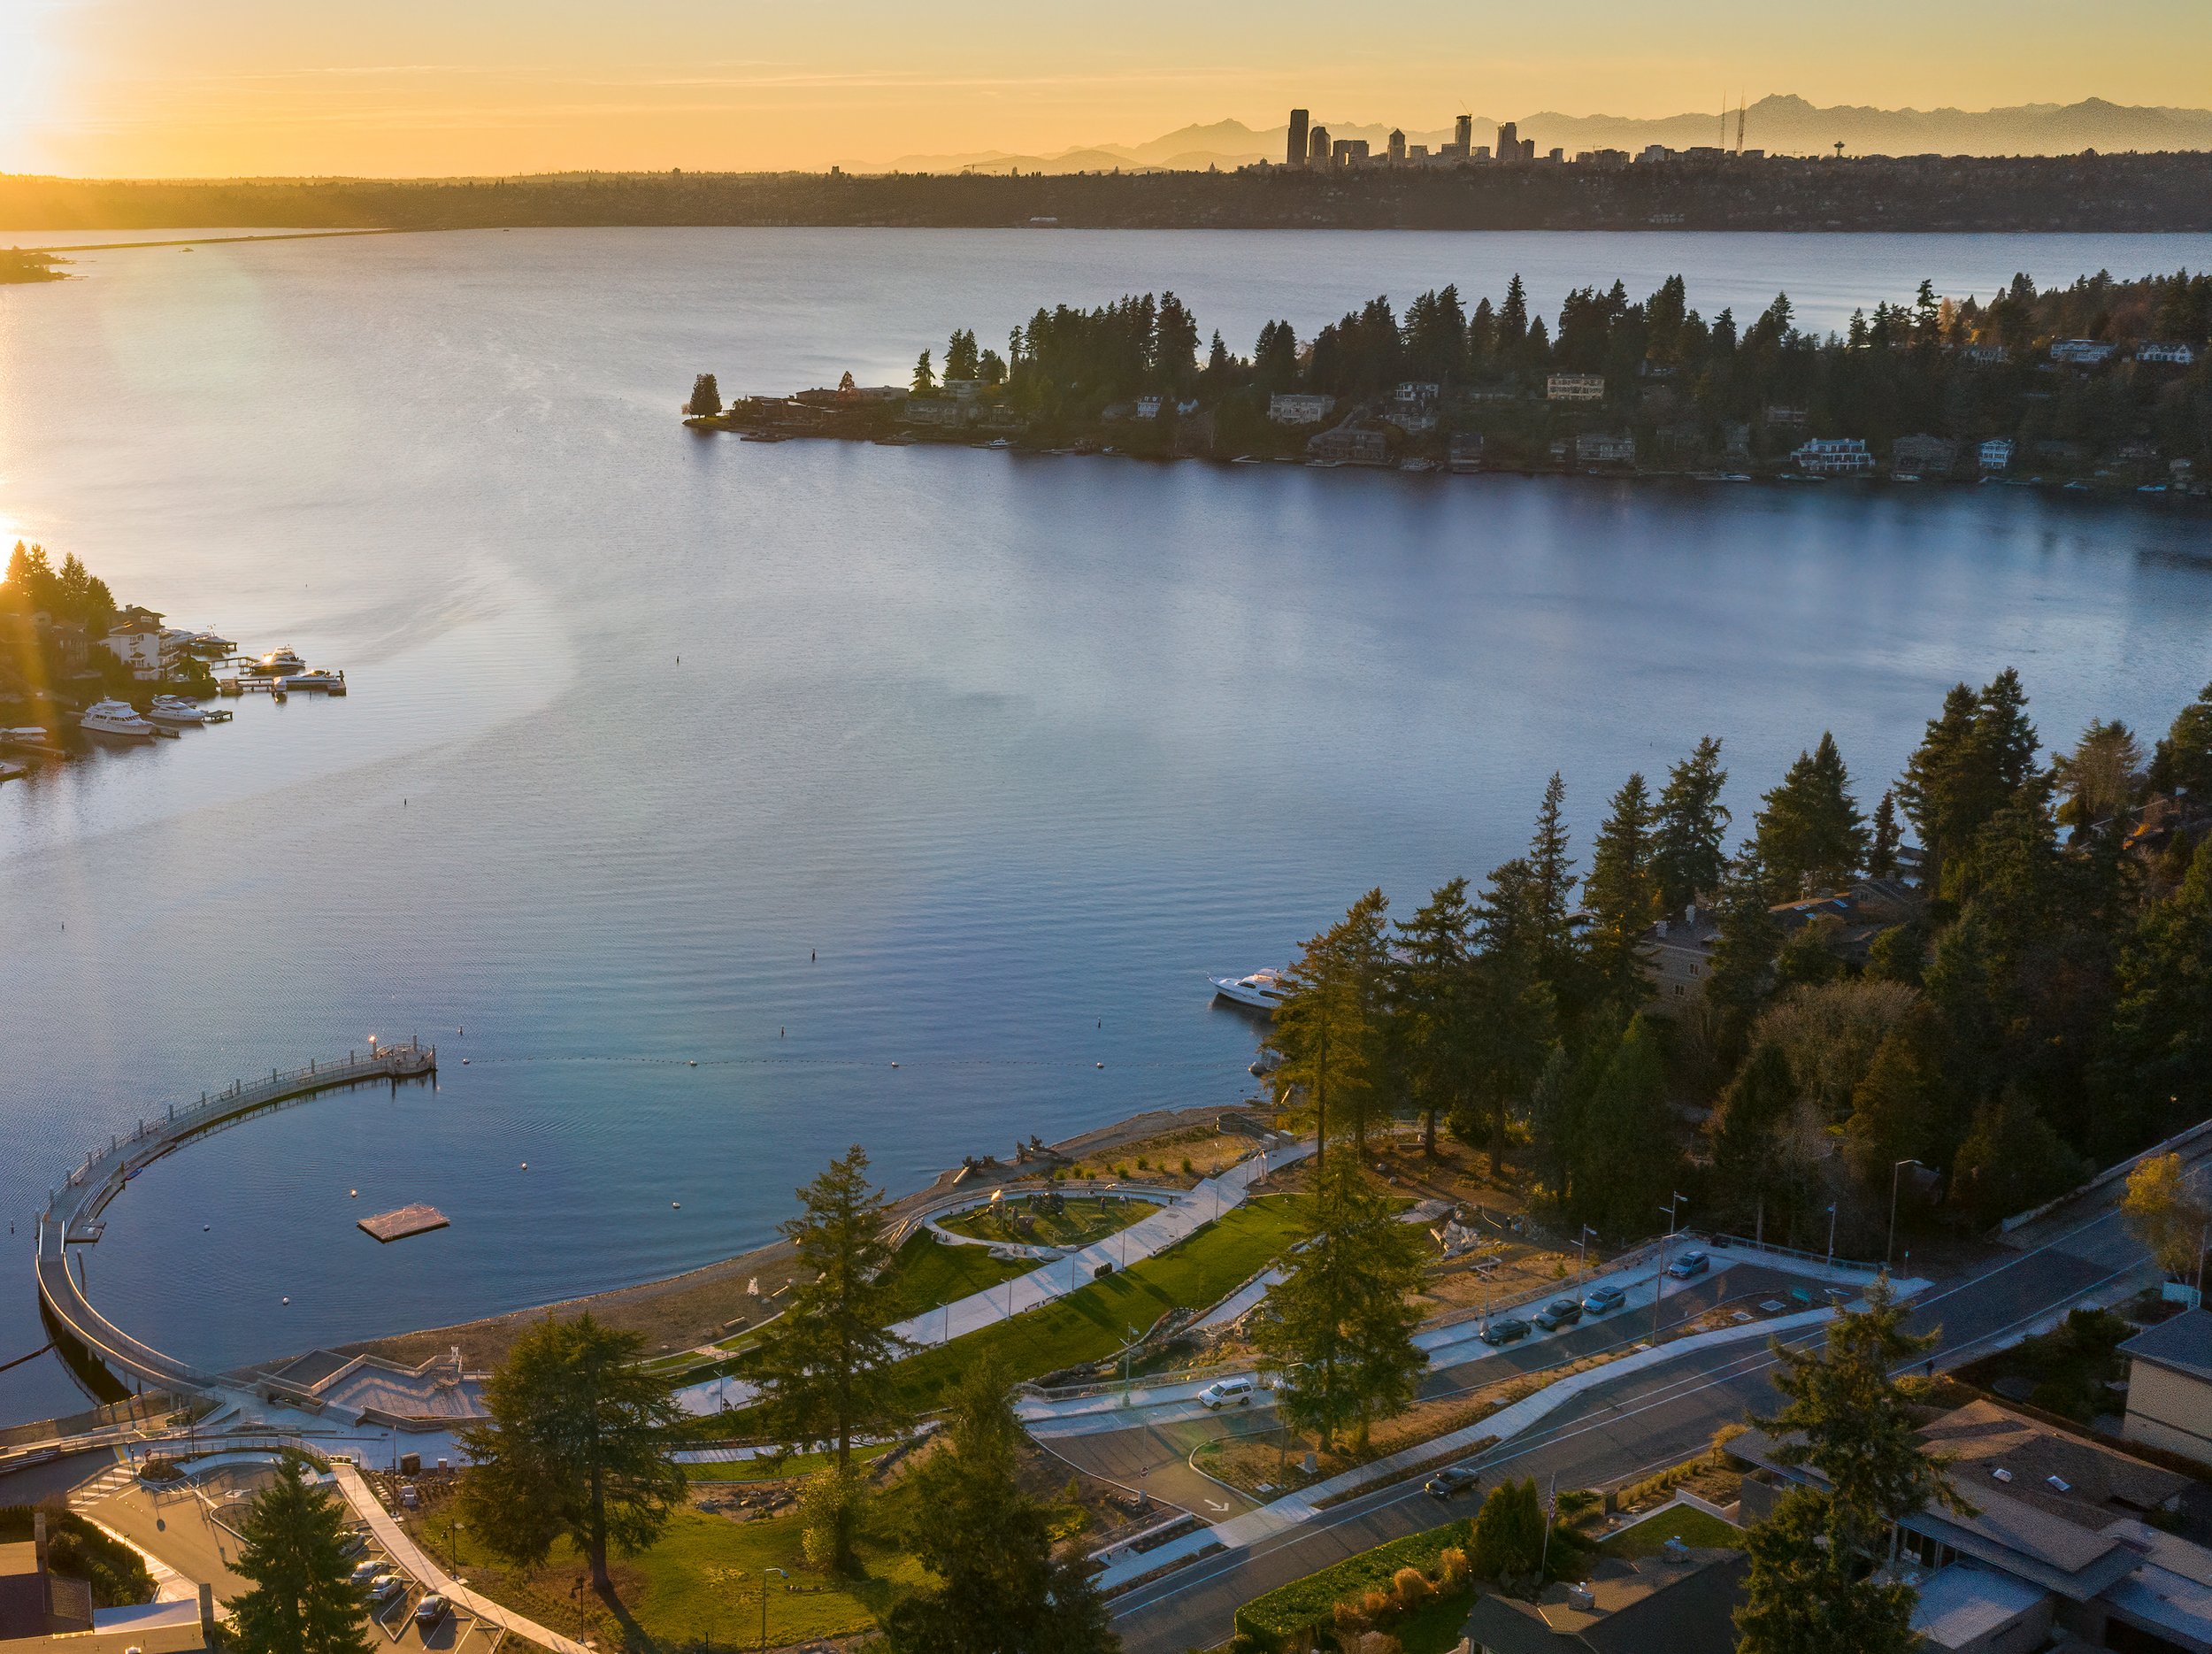
Eastside Waterfront Lifestyle
Mercer Island · Bellevue · Kirkland · Lake Washington
Experience the waterfront lifestyle these markets offer — before you ever step on a dock.
Aerial and lifestyle footage of Lake Washington waterfront communities — Eastside, WA
Schedule a Waterfront Tour →Deep-Dive Market Guides
Explore Every Waterfront Market
Each guide covers neighborhoods, lifestyle, schools, commute, buyer frameworks, and complete FAQ sections — 5,000+ words of expert local knowledge per market.
All Markets
Eastside Waterfront
Complete Comparison Guide
Lake Washington
Mercer Island
$3M – $28.5M+ · Island Privacy
Lake Washington
Bellevue
$2M – $50M+ · Urban Waterfront
Lake Washington
Kirkland
$2M – $20M+ · Walkable Lifestyle
Lake Sammamish
Lake Sammamish
$1.5M – $10M+ · Family Swimming
Lake Sammamish
Issaquah
$1.5M – $8M · Trails & Value
Puget Sound · True Island Living
Bainbridge Island Waterfront
$1.2M – $12M+ · Ferry Lifestyle · Olympic Mountain Views · 126 ft Avg Frontage
Expert Analysis
Waterfront Market Insights & Comparisons
Market Comparison · 2025
Mercer Island Waterfront vs. Bellevue Waterfront Homes
Price, schools, commute, and lifestyle compared across two of Lake Washington's most sought-after waterfront markets. The unbiased guide from a 25-year multi-market specialist.
Read the Comparison →Coming March 2026
Lake Sammamish vs. Lake Washington Waterfront
A complete side-by-side comparison of the Eastside's two primary waterfront lakes — price, frontage, safety, schools, and lifestyle.
Coming April 2026
5 Mistakes Eastside Waterfront Buyers Make
Dock rights, bulkhead conditions, beach access, HOA traps, and the due diligence most buyers skip — and how to avoid every one of them.
Coming April 2026
Kirkland vs. Mercer Island Waterfront
Schools, commute, lifestyle, and price compared — the two most frequently cross-shopped Lake Washington waterfront markets.
Historical Reports Archive
Update archive links in Squarespace by replacing the # href above with the actual URLs from your Market Reports pages.
Common Questions
Waterfront Market Report FAQ
How often is the Eastside waterfront market report updated?
Realogics Sotheby's International Realty publishes the Waterfront Report annually, typically in mid-year, analyzing the prior full calendar year of closed sales. The 2025 report covers all 2024 closed transactions. The 2026 report covering 2025 data is expected in spring 2026. Each report analyzes 16 communities across 12 counties.
Which Eastside waterfront market has the highest appreciation?
Mercer Island recorded the most dramatic appreciation in the 2025 report, with median sales price increasing 57% from 2023 to 2024 — from approximately $5.16M to $8.11M. This reflects both the extreme scarcity of the market (only 18 sales in 2024) and the premium placed on Gold Coast west-facing estate properties.
How scarce is waterfront property on the Eastside?
Extremely scarce. According to the 2025 RSIR Waterfront Report, only 3.6% of all single-family homes sold across the analyzed counties in 2024 were waterfront properties. On Mercer Island specifically, just 18 waterfront homes sold — representing roughly 8% of all island sales. This scarcity is structural, not cyclical: no new waterfront land is being created.
Which waterfront market sells the fastest on the Eastside?
Lake Sammamish leads on market velocity with an average of 55 days on market, followed by Kirkland at 63 days and Bellevue at 72 days. Mercer Island has the longest average at 159 days — a reflection of the extreme price points involved and the smaller buyer pool for $5M–$28M island properties. Faster DOM means more competition for buyers and faster liquidity for sellers.
What is the difference between Lake Washington waterfront and Lake Sammamish waterfront?
Lake Washington is larger, deeper, and carries significantly higher prestige — home to Mercer Island, Bellevue, and Kirkland waterfront at median prices of $3.86M–$8.11M. Lake Sammamish is smaller, calmer, and warmer, making it better for family swimming; it offers wider average frontage (130 ft) at lower median prices ($3.34M). Buyers often choose Lake Sammamish for value and water safety; they choose Lake Washington for prestige, views, and address recognition. For a full comparison, see our Eastside Waterfront Homes guide.

Freddy Delgadillo
Global Real Estate Advisor
Realogics Sotheby's International Realty
25 Years · Multi-Market · Unbiased
Data Is Only Useful With an Advisor Who Knows How to Apply It
The numbers in these reports tell you where the market has been. I tell you where it's going — and more importantly, whether a specific property on a specific date is priced correctly for what you're trying to accomplish.
With CLHMS certification, 25+ years of Eastside waterfront experience, and active representation across all six waterfront markets covered in this report, I provide the unbiased, cross-market expertise that single-market agents cannot.
Freddy@JudahRealty.com · 10237 Main Street, Bellevue, WA 98004