
Bellevue & Eastside Luxury Real Estate Market Report | Q2 2026
Expert Analysis: Seattle, Eastside, Puget Sound & Pacific Northwest Housing Trends
As Q2 2026 concluded, the Puget Sound real estate market completed a decisive shift toward buyer opportunity — with inventory expanding across nearly every region tracked, days on market lengthening, and pricing correcting in ten of the thirteen markets analyzed in this report. From Bellevue's urban core to Pierce County's affordable corridor, the second quarter revealed a market rebalancing after years of seller dominance, while select segments — Pierce County, Gig Harbor, and Bainbridge Island among them — bucked the trend entirely.
This comprehensive quarterly analysis, curated by Freddy Delgadillo of Judah Realty Group at Realogics Sotheby's International Realty, now expands beyond the Eastside to cover the full Puget Sound region — King, Snohomish, Pierce, Kitsap, and Island Counties — giving buyers and sellers the most complete picture available of where opportunity exists heading into Q3 2026.
This report is part of our ongoing Quarterly Market Reports series — explore prior quarters including Q1 2026, Q4 2025, and Q3 2025.
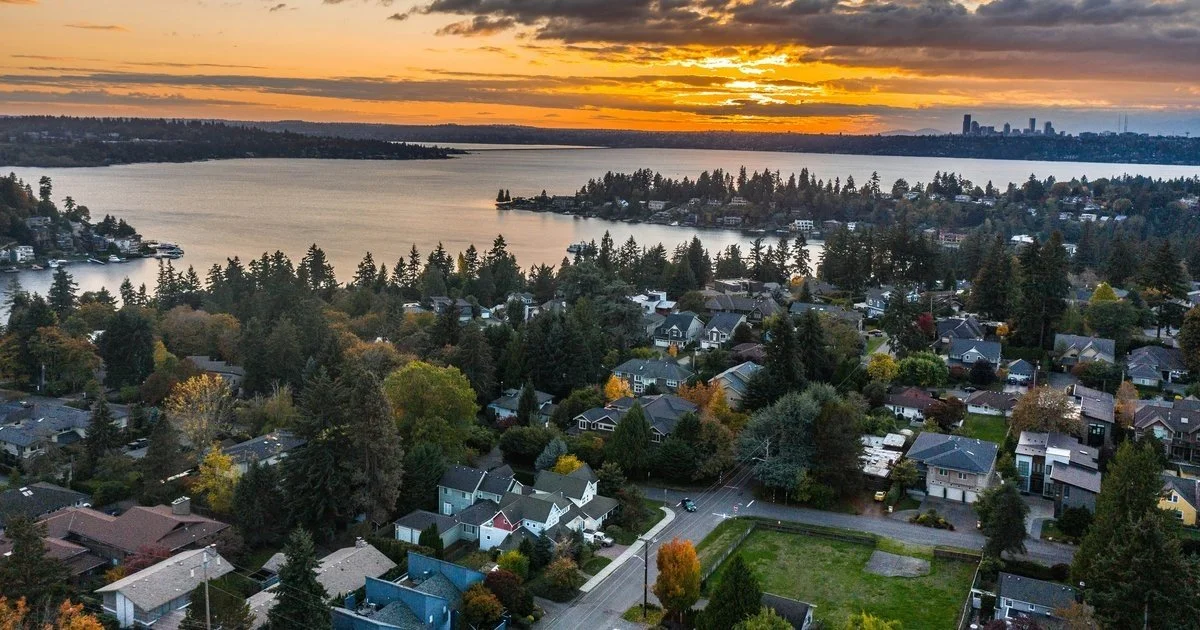
Lake Washington at sunset — Q2 2026 Eastside luxury market report
Key Market Insights Q2 2026
What Luxury Buyers & Sellers Need to Know
- Broad-Based Price Correction: 10 of the 13 Puget Sound markets tracked saw year-over-year price declines in Q2 2026, led by Eastside Condominiums (-12.02%) and Seattle Condominiums (-6.9%)
- Eastside Single-Family Softens: The Eastside single-family median fell 3.85% to $1,500,000 as average days on market nearly doubled to 29 (from 16 in Q2 2025)
- Condo Segment Crosses Into Buyer Territory: Both Seattle (5.1 months) and Eastside (5.5 months) condominium markets moved into neutral-to-buyer-favorable inventory levels — the most buyer-friendly condo conditions in years
- Cle Elum's Dramatic Shift: 11.8 months of supply and a 34.78% drop in homes sold mark the sharpest reversal of any market in this report — now firmly a buyer's market
- Rate Relief Continues: 30-year fixed mortgage rates eased to 6.4% in Q2 2026 (from 6.8% a year earlier), modestly improving affordability even as prices cooled across most segments
Navigating Q2 2026: Regional Market Performance Across the Puget Sound
Your Comprehensive Guide to Seattle, Bellevue, Eastside, Mercer Island, Snohomish, Pierce, Kitsap & Island County Trends
The second quarter is traditionally peak buying season — the window when spring listings mature into summer transactions and market direction for the second half of the year becomes clear. Q2 2026 delivered a market in transition: inventory grew across nearly every region as sellers who held back in Q1 came to market, while buyers — facing more choice and less urgency — took their time, pushing days on market higher almost everywhere.
For luxury homeowners and buyers evaluating a Q3 2026 move, understanding these regional shifts is essential. The insights below — supported by comprehensive data from the Northwest MLS via Realogics Sotheby's International Realty — reveal exactly how your community performed and where the real opportunities lie heading into fall.

King County • Single-Family Homes
As the most populous county in Washington state, King County offers a property type and price point for nearly every buyer — and Q2 2026 tested that breadth. Despite a 16.66% year-over-year increase in homes listed for sale, the market remained seller-favorable with 2.9 months of supply. Homes sold more quickly here than in most other communities analyzed in this report, averaging 27 days on market, though that was up from 19 days a year earlier.
After price growth between Q2 2024 and Q2 2025, King County saw a modest correction: the median sales price declined 4.39% to $980,000, and the average price per square foot fell 3.16% to $552. Homes sold dipped 2.99% to 5,328 transactions. For Bellevue, Kirkland, and Redmond buyers and sellers, King County's Q2 performance is a reminder that even in a correcting market, sub-3-month supply keeps real leverage with sellers who price accurately.

Eastside • Single-Family Homes
The Eastside — anchored by Bellevue, Kirkland, and Redmond — saw its most significant supply shift of the year in Q2 2026. A 29.44% year-over-year increase in homes for sale pushed months of supply from 2.5 to 3.5, still within seller's-market territory but a meaningful move toward balance. Homes sold declined 6.86% as buyers took a more measured approach, and the average days on market nearly doubled — from 16 days in Q2 2025 to 29 days in Q2 2026.
The median sales price decreased 3.85% to $1,500,000, with the average price per square foot down 4.43% to $626. For Eastside real estate professionals, this quarter marks a genuine inflection point: buyers now have real room to negotiate on single-family homes in Bellevue, Kirkland, and Redmond in a way that wasn't available twelve months ago.
Seattle • Single-Family Homes
From floating homes on Lake Union to historic properties in Queen Anne, Seattle's single-family market held remarkably steady in Q2 2026 compared to a year earlier. Months of supply ticked up only slightly, from 2.5 to 2.6, keeping the city in seller's-market territory. Homes for sale increased just 3.92% year-over-year — a modest shift compared to the double-digit inventory gains seen elsewhere in the region.
The median sales price decreased 2.87% to $1,050,000, following an 8.01% increase the year prior, while the average price per square foot slipped 1.8% to $601. Homes sold declined 1.83%. Overall, Seattle's single-family segment navigated Q2 2026 more stably than most Puget Sound markets — a signal that established city neighborhoods continue to hold value even as broader conditions soften.
Mercer Island • Single-Family Homes
The most notable shift in Mercer Island's Q2 2026 market wasn't price — it was patience. Average days on market rose from 12 days in Q2 2025 to 42 days in Q2 2026, signaling buyers took a far more deliberate approach to this exclusive island community. Homes sold declined 9.72% year-over-year, from 72 to 65 transactions, though 3.2 months of inventory kept the island firmly in seller's-market territory.
Pricing told a more nuanced story: the median sales price stayed nearly flat, down less than 1% to $2,510,000, while the average price per square foot — the highest of any community in this report — rose 2.28% to $898. That divergence points to continued strength at the true trophy end of the island's market even as overall transaction pace slowed.
Bainbridge Island • Single-Family Homes
Bainbridge Island was one of only three markets in this report to see both rising prices and rising sales in Q2 2026 — a standout performance. Homes for sale declined 16.36% year-over-year even as homes sold increased from 109 to 113, a combination that kept the island in a tight 2.4-month, seller-favorable position. The average time on market actually improved, dropping from 30 days to 20 days.
The median sales price rose 2.16% to $1,369,000, while the average price per square foot held flat at $587. For buyers, this means Bainbridge Island — prized for its ferry-commute access to Seattle and Pacific Northwest lifestyle — required stronger, faster offers in Q2 2026 than the broader regional trend would suggest.
Snohomish County • Single-Family Homes
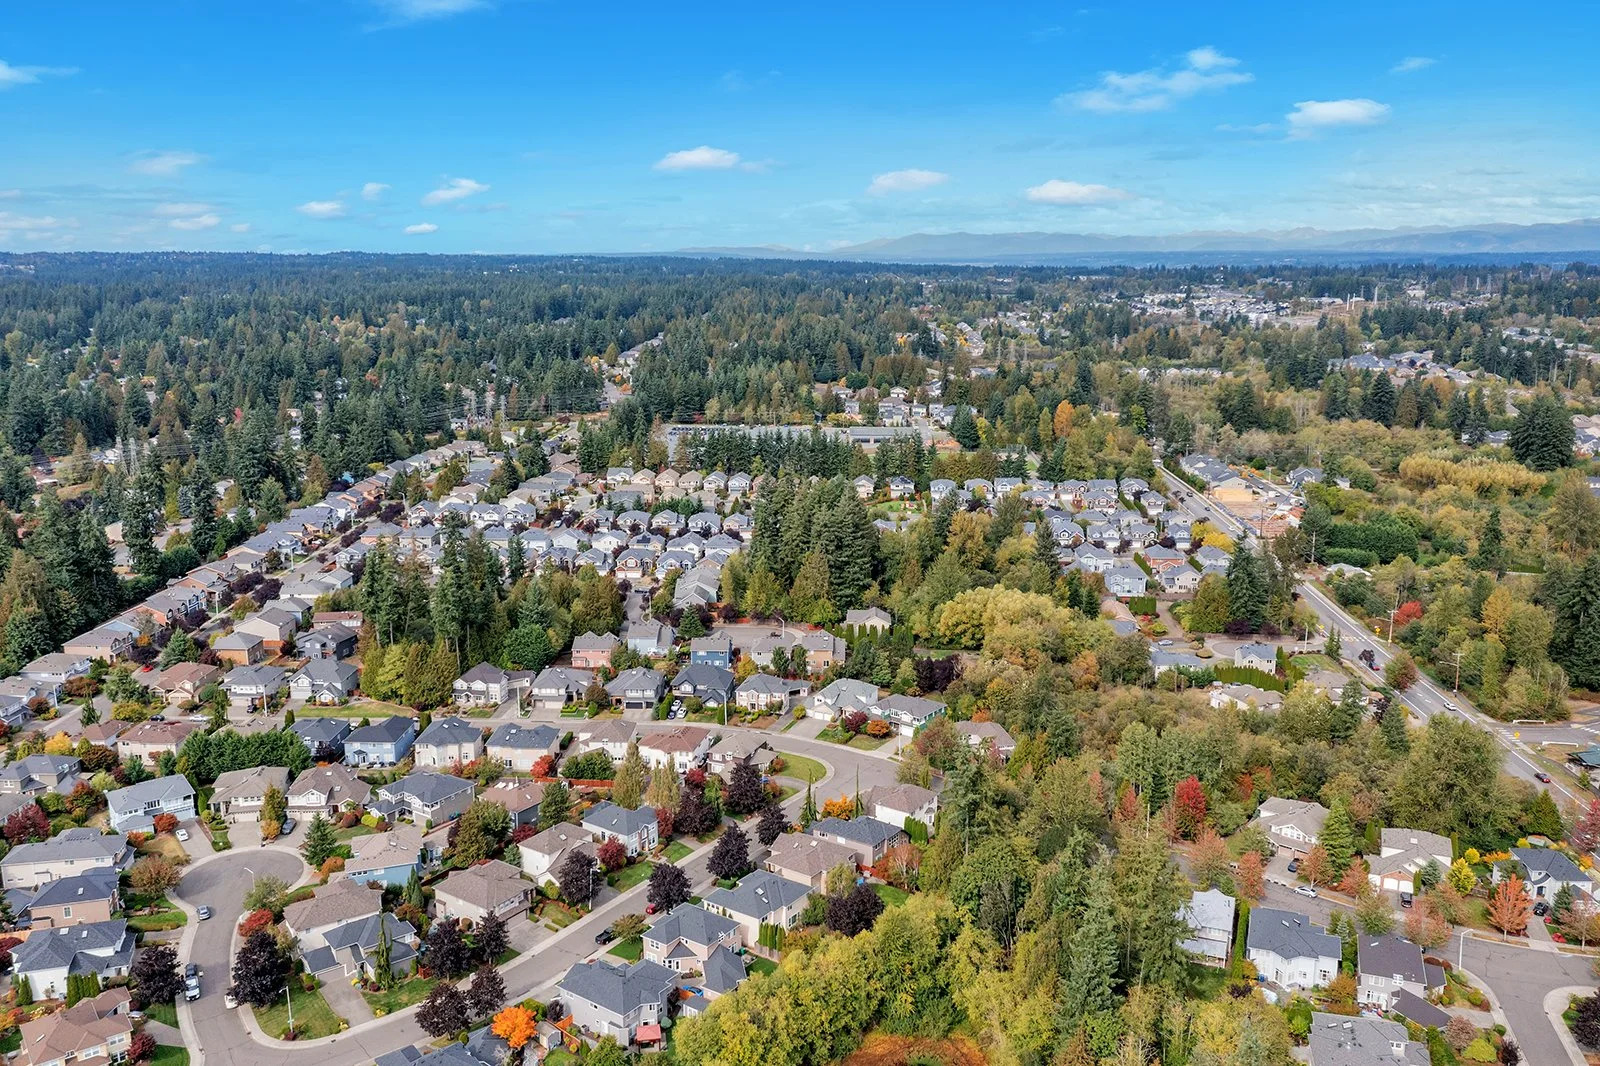
Located northeast of Seattle along the I-405 corridor, Snohomish County continued offering a different lifestyle and price point than its neighboring urban markets. After stagnant pricing between Q2 2024 and Q2 2025, the county saw a genuine correction in Q2 2026 — the median sales price fell 3.75% to $770,000, with the average price per square foot down a similar 3.94% to $414.
Inventory told the bigger story: homes for sale increased 25.32% year-over-year, from 1,627 to 2,039 listings, while homes sold declined 3.42%. Even so, 2.8 months of supply kept Snohomish in seller's-market territory. For buyers priced out of King County and the Eastside, Snohomish County's expanding inventory in Q2 2026 created meaningfully more options without sacrificing seller-market fundamentals entirely.
Pierce County • Single-Family Homes
Positioned between Thurston County to the south and King County to the north, Pierce County offers both affordable entry points and luxury estates — and it was one of the strongest-performing markets in this quarter's report. The median sales price rose 3.45% year-over-year to $600,000, continuing a small but consistent pattern of Q2 price growth over the past three years. At that price point, Pierce County remains significantly more accessible than King County's $980,000 median.
Homes sold increased 1.61% and the average price per square foot rose 0.93% to $324. Days on market lengthened modestly, from 31 to 35 days, and 2.8 months of supply kept the market seller-favorable — an improvement driven largely by a 15% year-over-year increase in homes listed for sale (from 2,346 to 2,698). Pierce County continues to be one of the Puget Sound's clearest value plays for buyers priced out of the Eastside.
Gig Harbor • Single-Family Homes
Gig Harbor delivered the strongest sales growth of any market in this report. Homes sold jumped 23.32% year-over-year, from 193 to 238 transactions, even as months of supply tightened from 3.4 to 2.8 — a combination that put real pressure on buyers to act decisively. Average days on market rose from 33 to 44 days, but that lengthening didn't translate into softer pricing.
The median sales price increased 5.66% to $914,000, while the average price per square foot rose roughly 1% to $421. Both figures have now increased year-over-year across each of the past three Q2 reports, underscoring steady, consistent demand in this charming Pierce County waterfront community. Buyers searching in Gig Harbor should expect to compete for well-priced listings.
Kitsap County • Single-Family Homes
Figures exclude Bainbridge Island, which is analyzed separately in this report.
Kitsap County offered the most affordable single-family median of any market tracked in this report at $563,000 — a fraction of Bainbridge Island's $1,369,000 median just across the water. That figure declined 1.75% year-over-year from $573,000, while the average price per square foot actually rose 0.65% to $311.
Days on market held essentially flat at 30 days (versus 29 a year earlier), and homes sold saw almost no change, down just 0.87%. Notably, Kitsap was one of the only markets in this entire report — alongside Bainbridge Island — where the number of homes for sale decreased year-over-year rather than increased, keeping supply tight at 2 months and preserving a firm seller's market.
Island County • Single-Family Homes
Home to waterfront destinations like Camano Island and Coupeville, Island County gave buyers more favorable conditions in Q2 2026 than they saw a year earlier — more inventory and lower prices, even as overall sales activity cooled. Homes sold declined 7.01% year-over-year, from 385 to 358 transactions, while the average days on market ticked up slightly from 38 to 42 days, continuing a small but steady three-year trend.
The median sales price settled at $630,000 — down 2.93% from Q2 2025's $649,000, though matching Q2 2024 levels almost exactly. The average price per square foot was essentially unchanged, down just one dollar to $385. With 3.9 months of inventory, Island County remained a seller's market, but one that's clearly loosening.
Cle Elum • Single-Family Homes
Southeast of Seattle's hustle and bustle, Cle Elum offers a quieter pace of life for weekend-getaway and work-from-home buyers — and Q2 2026 marked the region's most dramatic shift of any market in this report. With 11.8 months of supply, Cle Elum moved decisively into buyer's-market territory. Homes sold dropped 34.78% year-over-year, even as the number of listings increased 18%, laying bare a clear imbalance between supply and demand.
The median sales price fell 5.18% to $842,000, and the average price per square foot declined 1.6% to $493. One bright spot: the average time on market actually improved, from 64 days in Q2 2025 to 59 days in Q2 2026. For buyers willing to look beyond the Eastside, Cle Elum currently offers the strongest negotiating position of any market Judah Realty Group tracks.
Luxury Condominium Markets • Seattle & Eastside
Seattle Condominiums
Seattle's condominium market moved decisively toward buyer territory in Q2 2026, with months of supply rising from 4.3 to 5.1 — officially neutral-market conditions and the softest positioning in this segment in years. For buyers searching for a first home, a lock-and-leave residence, or an investment opportunity, that shift meant more options and considerably less pressure. Inventory rose 7.39% year-over-year while homes sold declined 10.49% to 461 transactions.
The average time a listing spent on market climbed to 52 days, up from 44 a year earlier, and the median sales price fell 6.9% to $540,000 — the steepest single-family-or-condo price correction of any market tracked outside the Eastside condo segment. Sellers in this space now need to price strategically and market thoughtfully to stand out to increasingly selective buyers.
Eastside Condominiums
Spanning Bellevue, Kirkland, and Redmond, the Eastside condominium market delivered the single steepest price correction of any market in this entire report. Supply expanded from 3.4 to 5.5 months — a full shift from seller's to neutral-market conditions — driven by a 19.62% year-over-year increase in homes for sale alongside a 26.12% decrease in homes sold, the largest sales decline tracked this quarter.
The median sales price fell 12.02% year-over-year, from $724,000 to $637,000, with the average price per square foot down 9.27% to $568. Days on market rose from 36 to 52. For buyers seeking lock-and-leave luxury on the Eastside, Q2 2026 represented the most favorable condominium buying window in recent memory — a dynamic worth discussing with an experienced Bellevue realtor before conditions shift again.

The Market Shifted. My Strategy Shifts With It.
Numbers tell you what happened last quarter. Twenty-five years on the Eastside tells me what to do about it — for your specific property, your timeline, and your goals, not the market average.
Whether you're pricing a home for a market that's cooling faster than the headlines suggest, or hunting for value in a segment that just tipped in your favor, I'll give you the same data-driven read I give every client, in plain language, with a strategy that's actually yours.
Freddy M. Delgadillo
Founder, Judah Realty Group
Bellevue Realtor | Luxury Real Estate Agent
Realogics Sotheby's International Realty
📞 Direct: (425) 941-8688
📍 Office: 10237 Main St, Bellevue
✉️ Email: Freddy@JudahRealty.com
📱 Follow: @JudahRealty
© 2026 Realogics Brokerage, LLC. All rights reserved. Sotheby's International Realty® and the Sotheby's International Realty Logo are service marks licensed to Sotheby's International Realty Affiliates LLC and used with permission. Realogics Brokerage, LLC fully supports the principles of the Fair Housing Act and the Equal Opportunity Act. Each franchise is independently owned and operated.