
Q2 2026 Bellevue & Eastside Luxury Market Report
Q2 2026 delivered a bifurcated Eastside luxury market: single-family homes held firm as a seller's market at 3.5 months of supply, while Eastside condominiums shifted to a neutral market at 5.5 months, giving buyers meaningfully more leverage. The Eastside single-family median sales price settled at $1,500,000, down 3.85% year-over-year, and mortgage rates eased to 6.4% from 6.8% a year ago. Across the wider Puget Sound region, most single-family markets remained seller-favorable, while both condo markets and outlying Cle Elum offered buyers the most room to negotiate.
King County • Single-Family Homes
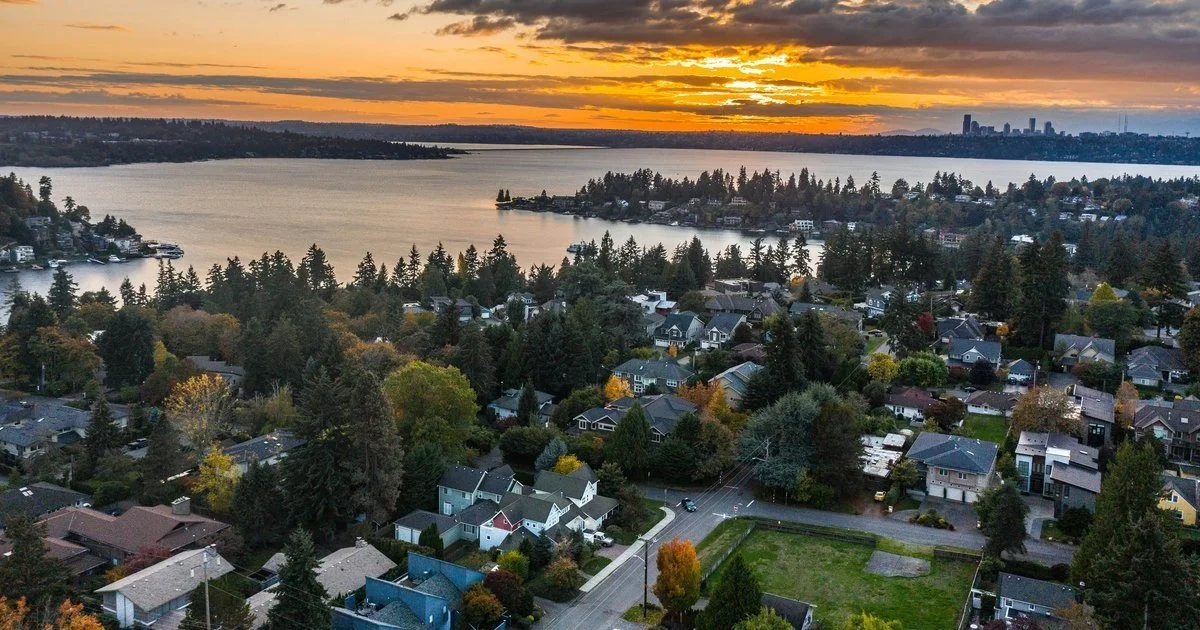
King County's luxury single-family market held its seller's-market designation through Q2 2026, with 2.9 months of supply consistent with the region's persistent scarcity. Homes sold declined a modest 2.99% year-over-year to 5,328 transactions, while the median sales price corrected 4.39% to $980,000 — a strategic pullback after 2025's elevated pricing. The average price per square foot fell 3.16% to $552. Perhaps most notable was the shift in days on market: properties took an average of 27 days to sell, up from 19 days a year earlier, giving buyers slightly more room to conduct due diligence without the intense urgency of 2025's multiple-offer environment. Even so, with a 16.66% year-over-year jump in new listings absorbed at this pace, King County's fundamental demand remained intact. For Bellevue and Eastside buyers weighing King County comps, the takeaway is consistency: this remains a market that rewards decisive, well-prepared offers even as conditions soften modestly from peak intensity. Download King County Q2 2026 Detailed Report →
Eastside • Single-Family Homes
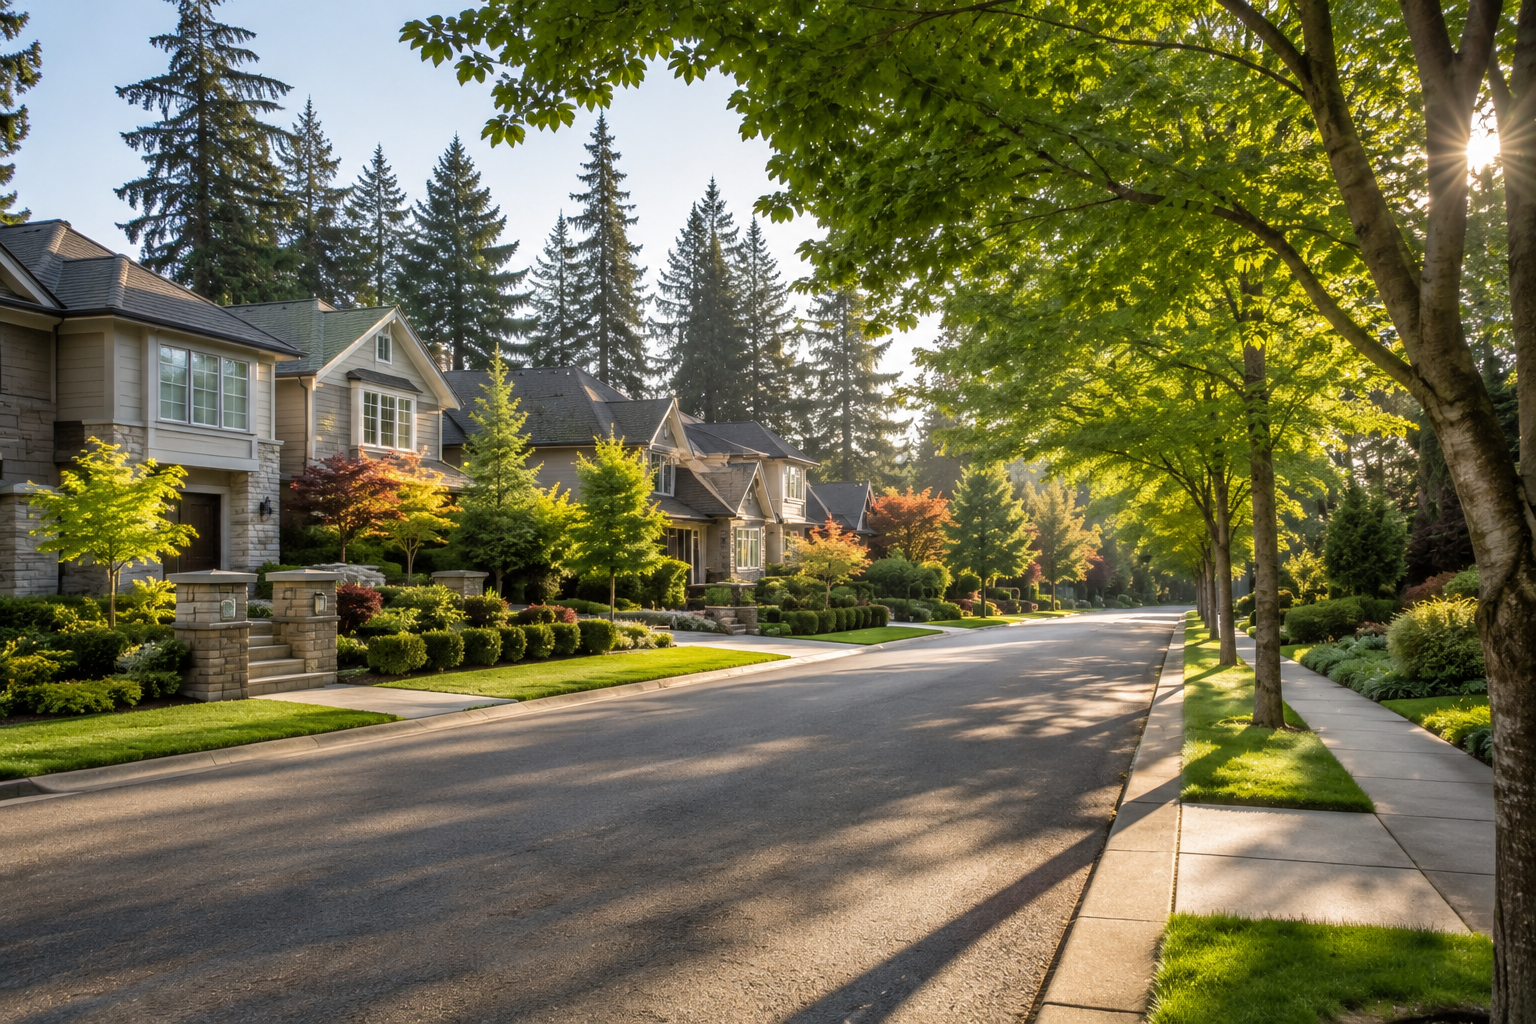
The Eastside — anchored by Bellevue, Kirkland, Redmond, and Sammamish — saw inventory climb 29.44% year-over-year, pushing months of supply from 2.5 to 3.5. Even with that increase, the market remained seller-favorable, well under the 4-month neutral threshold. Homes sold slipped 6.86% to 1,398 transactions, and the median sales price settled at $1,500,000 — a 3.85% correction from Q2 2025's $1,560,000. Average days on market nearly doubled, from 16 to 29 days, reflecting buyers taking more time to evaluate options in a less frenzied environment. The average price per square foot declined 4.43% to $626. This is a market recalibrating, not retreating. Sellers pricing accurately against current comps continue to transact efficiently, while buyers finally have room to negotiate terms that would have been unthinkable in 2024-2025's scarcity-driven bidding wars. Download Eastside Q2 2026 Detailed Report →
Mercer Island • Single-Family Homes
Mercer Island tightened back into a seller's market in Q2 2026 at 3.2 months of supply — a reversal from Q1's brief neutral-market window. Pricing held remarkably flat, with the median sales price essentially unchanged at $2,510,000 (down just 0.79% year-over-year), while the average price per square foot climbed 2.28% to $898 — the highest per-square-foot figure of any market in this report. Homes sold declined 9.72% to 65 transactions, and average days on market rose sharply from 12 to 42 days, signaling buyers are taking meaningfully longer to commit even on this island's most coveted addresses. That patience hasn't dented pricing power for well-positioned waterfront and view properties, which continue to command premium per-square-foot values. For Mercer Island buyers, Q2 2026 rewarded thorough due diligence over rushed decisions — the extended days-on-market window created space to properly evaluate dock rights, view corridors, and school enrollment strategy without losing out to reckless competing offers. Download Mercer Island Q2 2026 Detailed Report →
Bainbridge Island • Single-Family Homes
Bainbridge Island tightened further in Q2 2026, with months of supply falling to 2.4 (a seller's market) despite listings dropping 16.36% year-over-year from 110 to 92 homes. Demand outpaced that shrinking supply: homes sold rose 3.67% to 113 transactions, and the median sales price increased 2.16% to $1,369,000. Days on market compressed notably, from 30 days in Q2 2025 to just 20 days in Q2 2026 — a clear signal that well-priced ferry-accessible waterfront properties are moving quickly again after 2025's more measured pace. The average price per square foot held essentially flat at $587. Bainbridge Island buyers should expect renewed competition for the island's limited inventory, particularly for properties combining ferry-commute viability with genuine waterfront access. Download Bainbridge Island Q2 2026 Detailed Report →
Snohomish County • Single-Family Homes
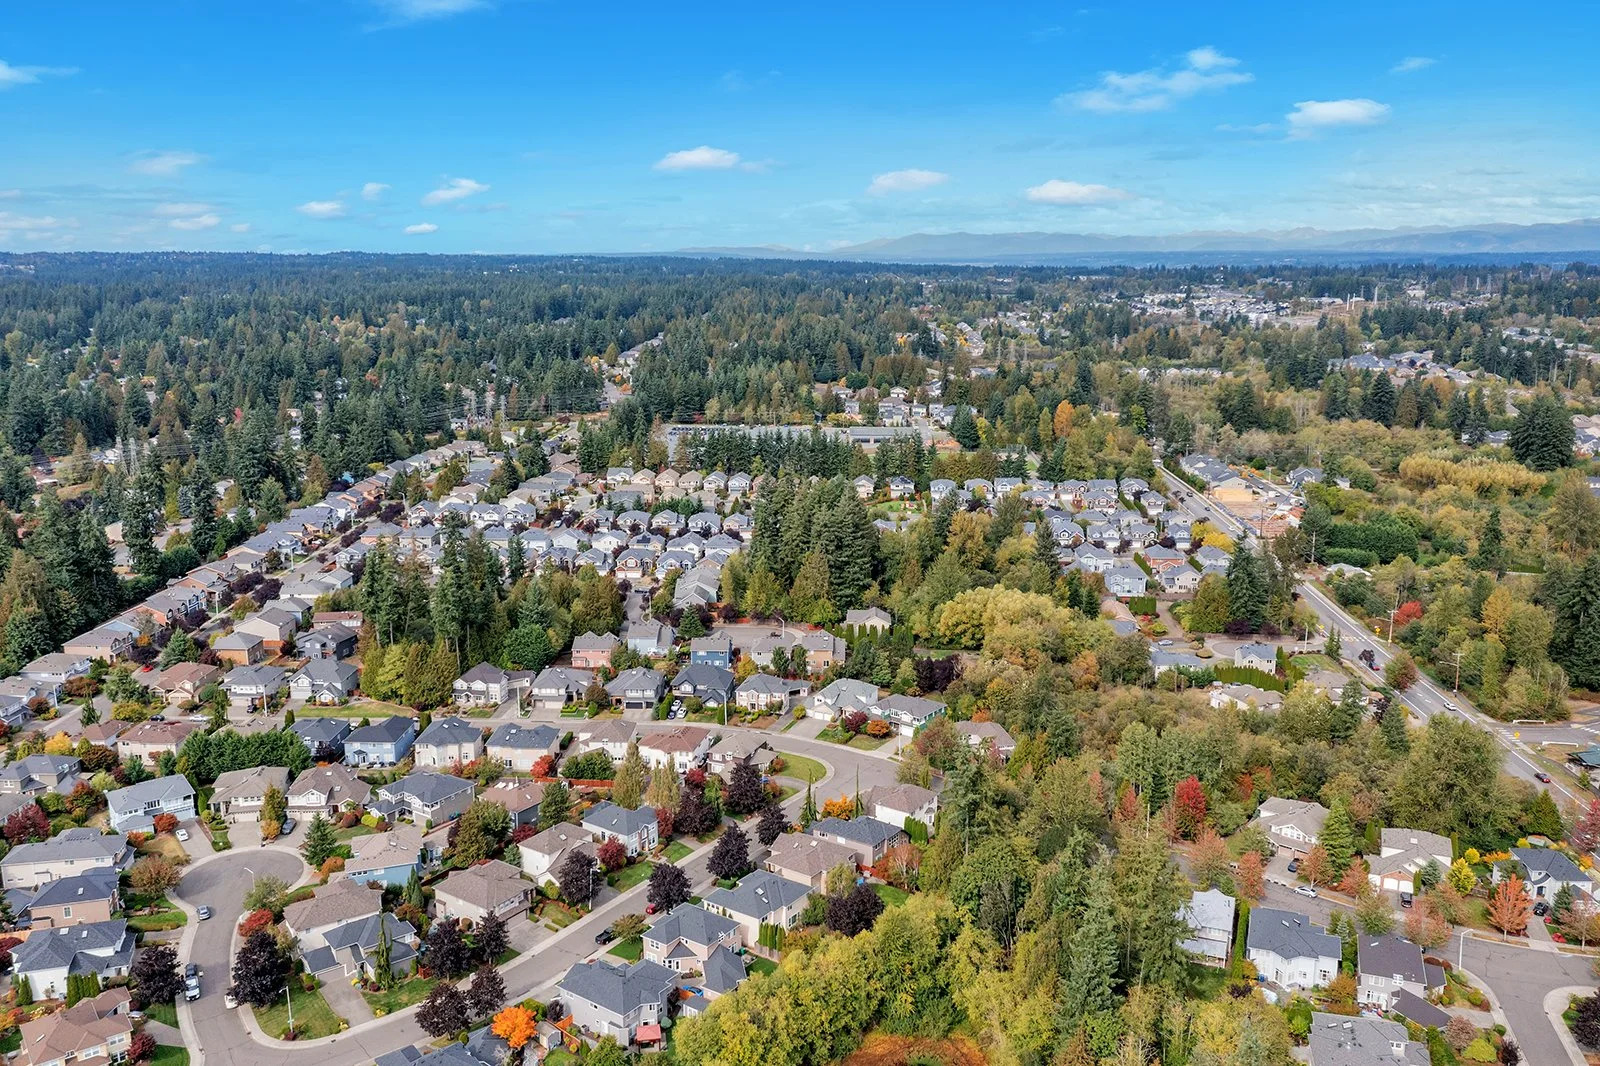
Snohomish County continued offering compelling value against Eastside pricing, with a median sales price of $770,000 — roughly half of the Eastside's $1,500,000 median. Inventory grew 25.32% year-over-year to 2,039 homes for sale, nudging months of supply from 2.0 to 2.8, though the market remained solidly seller-favorable. Homes sold declined 3.42% to 2,200 transactions, and the median sales price corrected 3.75% year-over-year. The average price per square foot fell a similar 3.94% to $414 — still substantially below Eastside per-square-foot pricing of $626. For buyers prioritizing space and value over urban proximity, Snohomish County remains one of the region's clearest value plays, with waterfront and acreage properties available at a fraction of comparable Eastside pricing. Download Snohomish County Q2 2026 Detailed Report →
Seattle Condominiums
Seattle's condominium market moved to neutral conditions in Q2 2026, with months of supply rising to 5.1 — squarely within the neutral band. The median sales price declined 6.9% year-over-year to $540,000, and homes sold fell 10.49% to 461 transactions. Average days on market rose from 44 to 52 days, and the average price per square foot dropped 4.92% to $580. This continues Seattle condos' pattern from Q1: a market offering genuine selection and negotiating room for buyers, particularly downsizers and investors evaluating lock-and-leave options against single-family alternatives. Download Seattle Condos Q2 2026 Report →
Eastside Condominiums
Eastside condominiums — concentrated in downtown Bellevue and Kirkland — shifted decisively to a neutral market in Q2 2026, with months of supply climbing from 3.4 to 5.5. The median sales price corrected 12.02% year-over-year to $637,000, and homes sold declined 26.12% to 379 transactions. The average price per square foot fell 9.27% to $568. This is the most buyer-favorable shift of any Eastside segment this quarter. Tech professionals and empty-nesters seeking lock-and-leave luxury in downtown Bellevue or Kirkland now have meaningfully more selection and negotiating leverage than at any point in the past year. Download Eastside Condos Q2 2026 Report →
Puget Sound at a Glance: Additional Markets
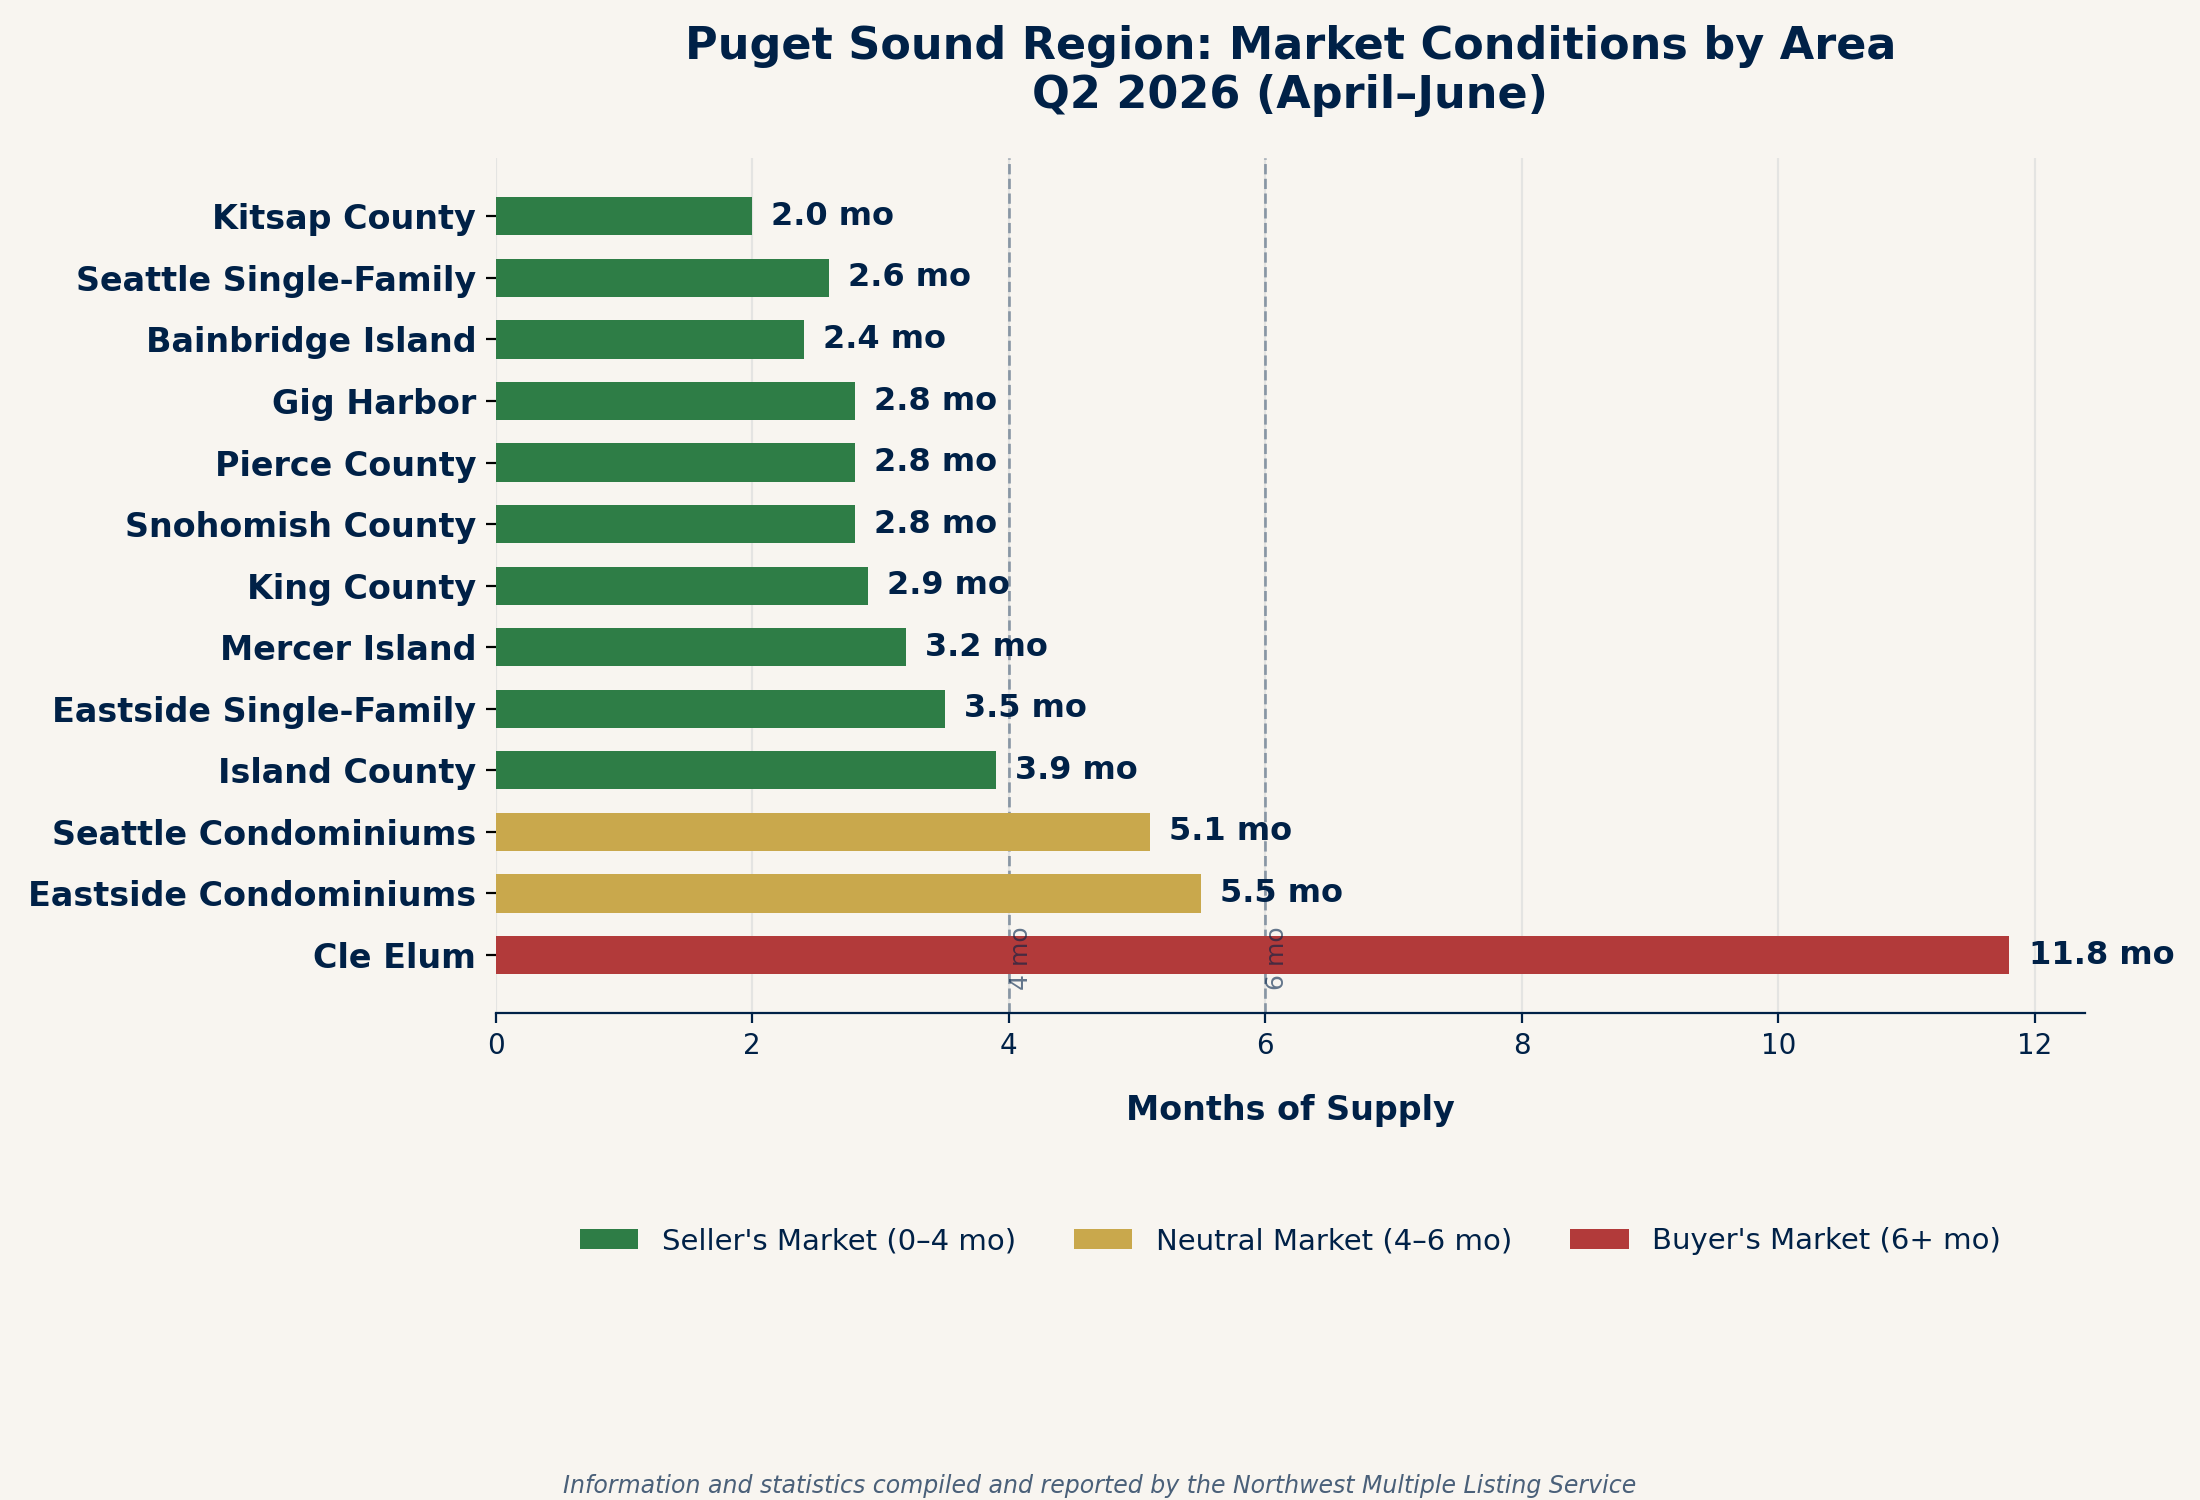
Beyond the Eastside's core communities, the broader Puget Sound region offers useful context for buyers considering a wider search radius:
| Market | Median Price | YoY Change | Months Supply | Condition |
|---|---|---|---|---|
| Seattle Single-Family | $1,050,000 | ↓2.87% | 2.6 | Seller's |
| Pierce County | $600,000 | ↑3.45% | 2.8 | Seller's |
| Gig Harbor | $914,000 | ↑5.66% | 2.8 | Seller's |
| Kitsap County | $563,000 | ↓1.75% | 2.0 | Seller's |
| Island County | $630,000 | ↓2.93% | 3.9 | Seller's |
| Cle Elum | $842,000 | ↓5.18% | 11.8 | Buyer's |
Information and statistics compiled and reported by the Northwest Multiple Listing Service.
Q2 2026 Eastside Real Estate FAQ
Is the Eastside luxury real estate market a buyer's or seller's market in Q2 2026?
The Eastside single-family luxury market remained a seller's market in Q2 2026 with 3.5 months of supply, though this was up from 2.5 months a year earlier. Eastside condominiums shifted to a neutral market at 5.5 months of supply, giving buyers meaningfully more negotiating room than in the single-family segment.
What is the median home price on the Eastside of Seattle in 2026?
The median sales price for Eastside single-family homes was $1,500,000 in Q2 2026, a 3.85% decrease from $1,560,000 in Q2 2025. Eastside condominiums had a median sales price of $637,000, down 12.02% year-over-year.
How does Mercer Island's real estate market compare to the rest of the Eastside?
Mercer Island posted a median sales price of $2,510,000 in Q2 2026, roughly 67% higher than the broader Eastside single-family median. Mercer Island's average price per square foot rose 2.28% year-over-year to $898, the highest of any Eastside market tracked, while the market remained seller-favorable with 3.2 months of supply.
Are mortgage rates dropping in 2026?
Yes. The average 30-year fixed conventional mortgage rate was 6.4% in Q2 2026, down from 6.8% in Q2 2025, according to Movement Mortgage data. This is an improvement in buyer affordability compared to the prior year, though rates ticked up slightly from Q1 2026's 6.1%.
What areas of the greater Puget Sound region are seller's markets right now?
As of Q2 2026, King County, the Eastside single-family market, Mercer Island, Bainbridge Island, Snohomish County, Seattle single-family, Pierce County, Kitsap County, Gig Harbor, and Island County all remained seller's markets with under 4 months of supply. Eastside and Seattle condominiums shifted to neutral markets, and Cle Elum remained a firm buyer's market with 11.8 months of supply.
🏆 500+ Eastside Transactions · 🎓 CLHMS · CRS · ABR · GRI · CSP
⭐ 425 Magazine & Seattle Times Featured · 🌐 Bilingual English/Spanish

Q2's Data Tells a Story — Let's Talk About Yours
Whether you're weighing a summer sale while single-family inventory remains tight, or eyeing the new leverage in the Eastside condo market, timing and pricing strategy matter more than ever in a market this nuanced.
With 25+ years and 500+ Eastside transactions, I can walk you through exactly what these numbers mean for your specific property or search.
📞 (425) 941-8688 ·
✉ freddy@judahrealty.com
10237 Main Street, Bellevue, WA 98004