
What the May 2026 NWMLS Data Means for Eastside Buyers & Sellers
Market Reports · June 2026
The 60-Second Summary:
What Just Happened in the Market
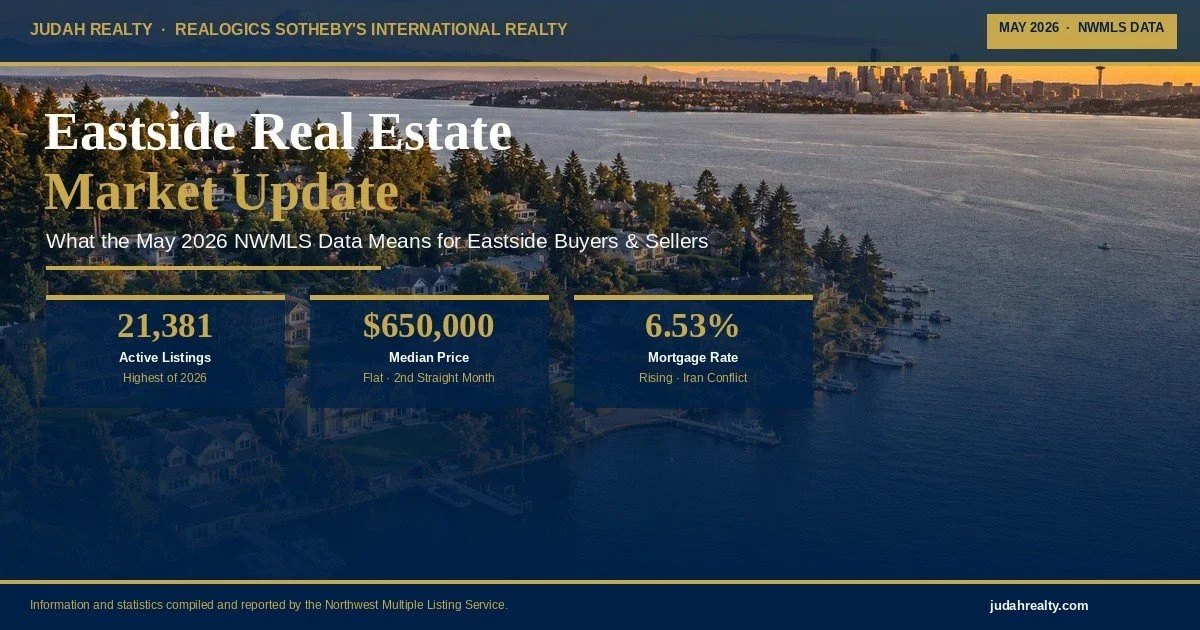
The Northwest Multiple Listing Service released its May 2026 Market Snapshot this week, and the headline is straightforward: there are more homes for sale than at any other point this year, prices are holding steady, and buyers are still actively touring properties — even as mortgage rates ticked higher again in May.
Active listings across the NWMLS service area reached 21,381 homes by the end of May — up 15.2% from April and 16.8% higher than a year ago. That is nearly 2,800 more homes than buyers had to choose from just one month earlier. Despite that surge in supply, the median sales price held flat at $650,000 for the second consecutive month, declining less than 1% compared to May 2025. Prices are not falling.
At the same time, 30-year mortgage rates rose from 6.30% at the end of April to 6.53% at the end of May, driven by energy cost inflation tied to the ongoing conflict in Iran. That rate increase is real, and it is squeezing affordability for some buyers. But the engagement data tells a different story than the headlines might suggest: keybox activity at listed properties was up 12.2% from April, and more than 25,000 listings received at least one showing during the month. The market is moving — it is simply moving with more nuance than the past few years required.
Here is what the full data set means — specifically for buyers and sellers on the Eastside of Seattle.
The Three Numbers Every
Eastside Homeowner Should Know
Most real estate market coverage throws data at you without explaining what it means. Here is a plain-English framework for reading any market update — including this one.
1. Months of Supply — The Most Important Number
What it is: If no new homes were listed today, how many months would it take to sell everything currently on the market? What it means: Below 4 months = sellers have leverage. 4–6 months = balanced, neither side dominates. Above 6 months = buyers have leverage. The NWMLS reports 3.44 months across Washington state in May — technically still a seller-leaning market overall, though specific Eastside submarkets like West Bellevue (8.41 months) are firmly in buyer territory. Knowing your submarket's number is far more useful than the statewide figure.
2. Median Sales Price — The Stability Signal
What it is: The middle price point of all homes that actually closed — half sold above, half below. What it means right now: $650,000 statewide (unchanged from April). King County's median is $875,000. The fact that prices held flat despite a 15% surge in inventory is the most important data point in the entire May report. It signals that sellers are pricing homes correctly relative to demand, and that buyer demand — while softer than 2024 — has not evaporated.
3. Pending Sales — The Forward-Looking Indicator
What it is: Homes under contract — agreed upon but not yet closed. This is the leading indicator. Closed sales reflect decisions made 30–45 days ago. Pending sales tell you what buyers are doing right now. What it means: Pending sales were up 7.7% from April. That momentum, combined with a 12.2% increase in keybox activity, indicates buyers did not retreat in May despite the rate increase. They adapted.
Active Listings:
The Inventory Story in One Chart
The chart below shows how dramatically inventory expanded from April to May 2026 — and how it compares to May 2025. This is the single biggest shift in the May data set.
Chart 1 — Active Listings: April vs. May 2026 vs. May 2025
Information and statistics compiled and reported by the Northwest Multiple Listing Service.
Chart 2 — Closed Sales: Year-Over-Year & Month-Over-Month
Information and statistics compiled and reported by the Northwest Multiple Listing Service.
What This Means
If You're an Eastside Seller
The honest answer is that this is a precision market — and precision markets reward preparation. The May data does not tell a story of collapse. It tells a story of transition. Inventory is growing. The window where any home at any price sold quickly has closed. What replaced it is a market where well-priced, well-presented homes still move — and overpriced or under-prepared homes sit.
Here is what the data says about your specific situation:
| What's True | What It Means For You |
|---|---|
| Prices flat at $650K statewide, $875K King County | Your equity has not eroded. You have not missed a peak. |
| Inventory up 15.2% from April | Your home is competing with 2,800 more choices than last month. |
| Closed sales up 9.5% month-over-month | Buyers are active. The transaction volume is there. |
| Pending sales up 7.7% from April | Motivated, qualified buyers are writing contracts right now. |
| Keybox activity up 12.2% from April | Showings are happening. The buyers are touring. |
Information and statistics compiled and reported by the Northwest Multiple Listing Service.
The sellers who will struggle in this market are not those in bad locations or with bad homes. They are the ones who price as if it is still 2022. The sellers who will win are the ones who price at market, present with professional quality, and work with an advisor who knows which buyers are actively searching their submarket right now.
For a deeper look at Eastside submarket conditions — including which areas remain seller-favorable right now — read the April 2026 Eastside inventory analysis and the West Bellevue, Mercer Island, and East Bellevue market comparison published last month.
What This Means
If You're an Eastside Buyer
May 2026 is the best month of the year so far to be a buyer — not because prices are falling, but because you finally have choices. For the past several years, buyers in this market faced the frustration of wanting to buy and having almost nothing available that met their criteria. That dynamic has shifted.
The Buyer Opportunity in Three Points
1. More inventory than any other point in 2026. 21,381 active listings across the NWMLS service area. On the Eastside specifically, you are seeing homes in price ranges and neighborhoods that were essentially unavailable six months ago.
2. Sellers are motivated. When inventory climbs 15% in a single month, sellers take notice. Negotiating room that did not exist in 2024 is beginning to appear — particularly in balanced and buyer-leaning submarkets.
3. 73.1% of listings qualify for down payment assistance. This number matters more for move-up buyers than it might seem. When entry-level buyers have more purchase options, they free up mid-tier inventory, which in turn creates movement in the luxury segment.
The rate environment is real. At 6.53%, a $1.5M purchase carries meaningfully higher monthly costs than it did when rates were below 6%. But consider the other side of that calculation: as documented in the April market update, Eastside prices declined modestly over the past year. The buyer who waits for rates to drop to 5.5% is betting that prices will not recover — a bet the May stability data does not support.
For luxury waterfront buyers specifically, the calculus is different again. Supply in that segment is structurally constrained regardless of market conditions. Read the complete guide to what $5M, $10M, and $20M buys in Eastside waterfront real estate — published last month — for a current view of that market.
Median Price Stability:
The Story Sellers Need to See
The chart below shows Washington state median sales price across the past three data points. The flat line is the story — prices are not dropping despite the inventory surge.
Chart 3 — Median Sales Price: Stability Through Inventory Growth
Information and statistics compiled and reported by the Northwest Multiple Listing Service. Statewide residential and condominium median.
Chart 4 — Buyer Engagement Signals: May 2026 Month-Over-Month Growth
Information and statistics compiled and reported by the Northwest Multiple Listing Service. All figures represent May 2026 month-over-month change.
The Rate Conversation:
Honest Context, No Alarmism
Mortgage rates rose approximately a quarter of a percentage point in May, moving from 6.30% at the end of April to 6.53% by the end of May. The driver, according to the Washington Center for Real Estate Research at the University of Washington, is energy cost inflation tied to the ongoing conflict in Iran. Higher energy costs feed broader consumer price inflation, which in turn keeps the pressure on interest rates.
There is no clear timeline on when this changes. Anyone who tells you they know when rates will drop back toward 6% or below is speculating. What is knowable is this: the pattern in the NWMLS data over recent months has been consistent — inventory continues to grow relative to a year ago, while sales activity and prices are essentially flat. Until the rate environment shifts materially, that pattern is likely to continue.
What 6.53% Actually Means on an Eastside Purchase
On a $1,500,000 purchase with 20% down ($300,000), a 30-year fixed mortgage at 6.53% produces a principal and interest payment of approximately $7,585/month. At 6.00%, that same payment would be approximately $7,195/month — a difference of about $390/month, or $4,680/year. That gap is real, but it does not rewrite the fundamentals of a long-term real estate decision in one of the country's most supply-constrained markets.
King County and Snohomish:
The Eastside Numbers That Matter
The statewide data sets context. The county-level data tells you what is happening in the market where you actually live and buy. Here is how the two primary Eastside counties — King and Snohomish — compare to the state figures in May 2026.
| County | Median Price (May 2026) | vs. State Median | Context |
|---|---|---|---|
| King County | $875,000 | +34.6% above state | Bellevue, Kirkland, Mercer Island, Redmond |
| Snohomish County | $759,875 | +16.9% above state | Bothell, Woodinville, Kenmore corridor |
| San Juan County | $1,125,000 | Highest in state | Islands market — limited supply, premium lifestyle |
| Washington State | $650,000 | — | Statewide median benchmark |
Information and statistics compiled and reported by the Northwest Multiple Listing Service.
King County's $875,000 median reflects the premium the Eastside commands. But that headline number obscures significant variation across submarkets. The West Bellevue, Mercer Island, and East Bellevue comparison published last month breaks down those differences in detail. Snohomish County's growth in inventory — up 33.6% year over year, among the highest in the state — is creating buyer opportunities in the Bothell and Woodinville corridors that did not exist six months ago.
For the full luxury waterfront picture — including what the Eastside's most premium properties are trading for right now — the Eastside waterfront market hub and the $5M–$20M waterfront guide remain the most complete resources available. The Sotheby's International Realty 50th Anniversary perspective offers additional long-cycle market context worth reading alongside this month's data.
Finally, the Opening Day 2026 waterfront market analysis published in May remains a useful lens for understanding where waterfront demand sits as we head into the summer boating season.
Frequently Asked Questions:
May 2026 Eastside Market
Is it a buyer's or seller's market in Washington state right now?
As of May 2026, Washington state is approaching a balanced market. The NWMLS reports 3.44 months of supply statewide — below the 4–6 month range that defines a balanced market, but rising. Most Eastside submarkets remain competitive for well-priced homes, though West Bellevue at 8.41 months has moved into buyer's market territory. Knowing your specific submarket matters far more than the statewide figure.
What is the current months of supply in the NWMLS market area?
The NWMLS reports 3.44 months of supply across its service area in May 2026, up from 3.27 months in April. Industry standard defines a balanced market as 4–6 months. Below 4 months generally favors sellers; above 6 months generally favors buyers. The Eastside's tightest submarkets — East Lake Sammamish (2.57 months), Issaquah/Newcastle (2.63 months), and Mercer Island (2.88 months) — remain firmly in seller territory.
Are home prices dropping in the Seattle area in 2026?
Prices are essentially flat. The NWMLS median sales price for May 2026 was $650,000, unchanged from April and down less than 1% from May 2025. In King County, the median was $875,000. Despite significant inventory growth throughout the first half of 2026, prices have shown remarkable stability. The data does not support a narrative of declining values — it supports a narrative of moderation and equilibrium.
How are mortgage rates affecting the Eastside real estate market?
30-year mortgage rates rose from 6.30% at the end of April to 6.53% at the end of May 2026, driven by energy cost inflation tied to the conflict in Iran. Elevated rates are constraining affordability and slowing sales activity compared to a year ago. However, buyer engagement as measured by keybox activity (+12.2%) and showings (+5.0% month-over-month) remained active through May, suggesting buyers are adjusting to the rate environment rather than stepping away entirely.
Is now a good time to buy a home on the Eastside in 2026?
For buyers who are financially prepared, June 2026 presents more choices than any point this year. Active listings are at their 2026 high, sellers are motivated, and prices remain stable. The tradeoff is mortgage rates at 6.53%. Buyers who find the right home in a supply-constrained submarket like Mercer Island or East Bellevue are unlikely to see significant price declines — and waiting for rates to drop carries real opportunity cost. The right answer depends entirely on your financial readiness and your target submarket.

Freddy Delgadillo
Luxury Real Estate Advisor · Realogics Sotheby's International Realty
The Data Is Clear. Your Next Step Should Be Too.
Market reports tell you what happened. I tell you what it means for your specific property, your timeline, and your goals. Whether you're watching rates waiting to buy, sitting on equity wondering whether to sell, or evaluating a waterfront property at any price tier — this is the conversation that turns data into a decision. Twenty-five years on the Eastside means I've seen this market in every condition. Let's talk.
ABR® · Accredited Buyer's Representative | CRS · Certified Residential Specialist | GRI · Graduate REALTOR® Institute | CLHMS · Certified Luxury Home Marketing Specialist