
West Bellevue Has 8 Months of Supply. Mercer Island Has 3. Here's What $3.25M Buys in Each.

They sit within five miles of each other. They serve similar buyer profiles — tech executives, dual-income households, families relocating to the Eastside. They are all considered "Bellevue" or "greater Bellevue" by most national search platforms.
And in April 2026, they could not be more different.
West Bellevue (Area 520, west of I-405) has 8.41 months of supply and prices down $500,000 from a year ago. Mercer Island (Area 510) has 2.88 months of supply and is the only Eastside market where prices are actually rising. East Bellevue (Area 530, east of I-405) sits in between at 3.27 months — a seller's market where prices have barely moved.
Same I-90 corridor. Same luxury buyer profile. Three completely different market realities depending on which side of a freeway or body of water you are searching on.
Here is the full data breakdown — and what it means for your next move.
For the broader nine-market Eastside context, see Why Eastside Inventory Is Rising But Prices Aren't Falling →
The Three-Market Snapshot
(W of I-405)
16 pending (−23.8%)
🔴 Buyer's Market
28 pending (+33.3%)
🟢 Seller's Market
(E of I-405)
48 pending (−20.0%)
🟢 Seller's Market
Information and statistics compiled and reported by the Northwest Multiple Listing Service. April 2026 King County Area Statistics Report and Breakouts — Residential Only.
The Paradox That Opens This Story
Here is the number that stops most people: West Bellevue has a higher median sale price than Mercer Island — $3,250,000 versus $2,605,000. And yet Mercer Island prices are rising (+4.2%) while West Bellevue prices are falling (−13.3%).
More expensive market. Losing value faster. How?
The answer is supply and demand — specifically, the ratio between available homes and active buyers. West Bellevue had 143 active listings and only 17 closings in April. Mercer Island had 46 active listings and 16 closings. The absolute transaction volume is nearly identical — but the supply overhang in West Bellevue is roughly three times larger. That imbalance is what drives the price divergence, and it shows up clearly in the months of supply figure: 8.41 versus 2.88.
Chart 1 — Months of Supply: Three Markets · April 2026
Gold dashed line = 6-month buyer's market threshold. Red = buyer leverage. Green = seller's market.
Information and statistics compiled and reported by the Northwest Multiple Listing Service.
Market by Market: The Full Story
West Bellevue (Area 520) Buyer's Market
West Bellevue is the clearest buyer's market on the Eastside in April 2026 — and the data is unambiguous on every metric.
Active listings rose 70.2% year over year, from 84 to 143. Pending sales fell 23.8%, from 21 to 16. Only 17 homes closed in April. The median sale price dropped 13.3% to $3,250,000 — a $500,000 reduction versus the same month in 2025. Months of supply: 8.41, well into buyer's market territory.
The average sale price in West Bellevue — $4,213,706 — tells you something important about the composition of this market. The properties that are selling are the premium, best-positioned homes. The ones sitting are accumulating in the active count, which is why months of supply keeps climbing.
One counterintuitive data point: days on market fell from 27 to 19. The explanation is the same as the one in our last market report — the homes that sell in West Bellevue sell quickly, usually because they are priced to the current market. The 126 listings that have not sold simply don't appear in the DOM calculation. They are the supply overhang that defines the market.
Mercer Island (Area 510) Seller's Market
Mercer Island is the one market in this dataset where everything is pointing in the right direction — for sellers.
Active inventory declined 4.2% year over year — the only Eastside market with fewer homes available than 12 months ago. Pending sales surged 33.3%, from 21 to 28. The median sale price rose 4.2% to $2,605,000, against a backdrop of broad Eastside softness. Months of supply: 2.88.
The days on market figure — 45 days versus 6 days last April — looks alarming until you account for the sample. Only 16 homes closed in April. At that transaction volume, one or two homes that took longer to sell (estate situations, extended negotiations, off-market agreements that converted late) can move the average significantly. The pending sales surge is the more reliable signal, and it is pointing at sustained demand.
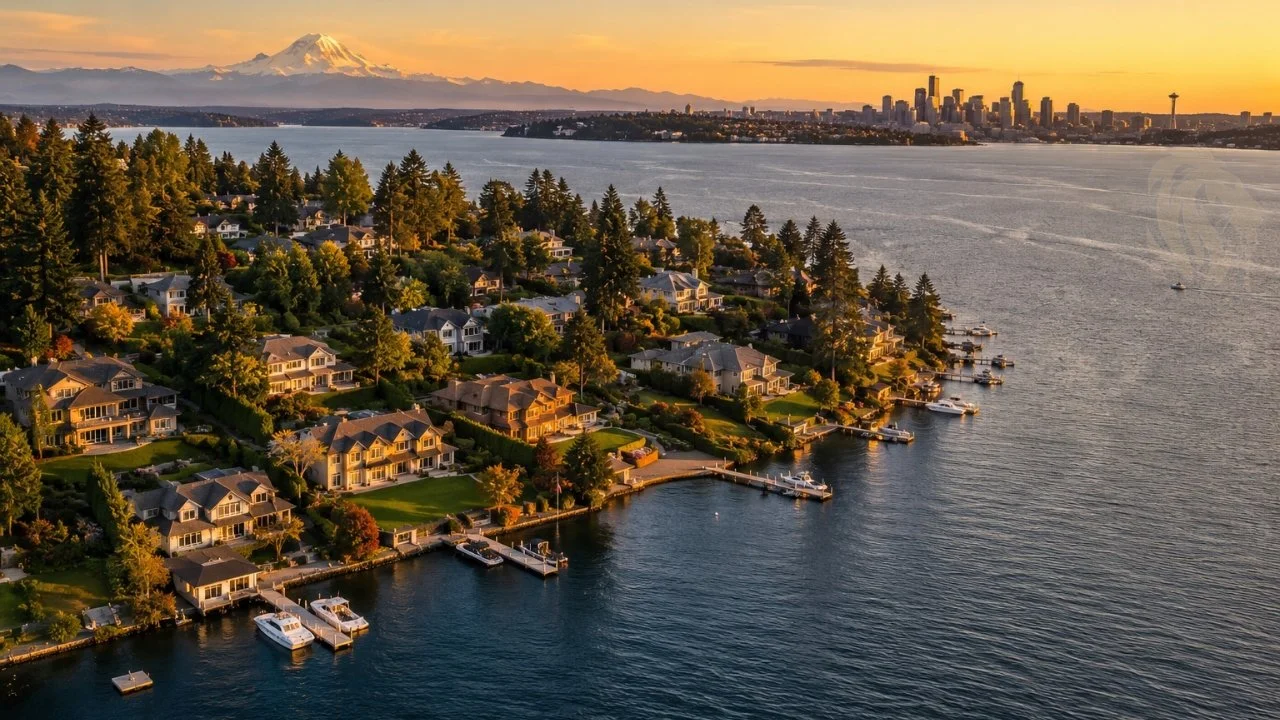
What makes Mercer Island durable in a softening market is the same combination of factors that has always distinguished it: the Mercer Island School District (consistently top-ranked in Washington state), I-90 dual access to both Seattle and Bellevue, full island privacy, and a waterfront community character that cannot be replicated on the mainland. In a market defined by uncertainty, Mercer Island buyers are buying something finite and scarce. That scarcity is the price floor.
East Bellevue (Area 530) Seller's Market
East Bellevue (east of I-405, including the Bridle Trails corridor, Crossroads, and the neighborhoods between 148th Ave NE and Issaquah) tells a quieter story — but an important one.
Active listings rose 61.6%, from 99 to 160. That is a significant inventory increase. And yet with 49 closings in April — the highest closed sales volume of the three markets in this analysis — months of supply sits at just 3.27. Demand is absorbing the supply. The median price declined only 2.9% to $1,650,000.
Days on market more than doubled (10 to 21 days), which reflects a market that is taking longer to transact but still transacting at a healthy pace. Pending sales fell 20%, which is worth monitoring — but 48 active contracts in a single month at the $1.65M median price point is still meaningful volume.
The strategic story in East Bellevue is the value proposition. At $1,650,000 median — with a budget of $3.25M — a buyer is 97% above the market median. That means exceptional quality at this price point: newer construction, larger lots, premium finishes, and a commute corridor that puts Microsoft, Amazon, and Google all within 20 minutes.
The Numbers Side by Side
Chart 2 — Median Sale Price: April 2026 vs. April 2025
Navy = April 2026 median. Gold = April 2025 median. The $500K West Bellevue drop is the defining visual.
Information and statistics compiled and reported by the Northwest Multiple Listing Service.
Complete Data: Three Markets · April 2026 vs. April 2025
| Metric | W. Bellevue (520) | Mercer Island (510) | E. Bellevue (530) |
|---|---|---|---|
| Months of Supply | 8.41 🔴 | 2.88 🟢 | 3.27 🟢 |
| Median Sale Price | $3,250,000 | $2,605,000 | $1,650,000 |
| Price vs. Apr 2025 | −$500,000 (−13.3%) | +$105,000 (+4.2%) | −$50,000 (−2.9%) |
| Avg Sale Price | $4,213,706 | $3,185,719 | $1,727,026 |
| Active Listings | 143 (+70.2%) | 46 (−4.2%) | 160 (+61.6%) |
| Pending Sales | 16 (−23.8%) | 28 (+33.3%) | 48 (−20.0%) |
| Closed Sales | 17 (−10.5%) | 16 (−20.0%) | 49 (−12.5%) |
| Days on Market | 19 days (▼ from 27) | 45 days* (▲ from 6) | 21 days (▲ from 10) |
| New Listings | 75 (+29.3%) | 46 (−9.8%) | 115 (−3.4%) |
| Market Condition | Buyer's Market 🔴 | Seller's Market 🟢 | Seller's Market 🟢 |
* Mercer Island DOM reflects 16-home sample — small-sample artifact. Pending surge (+33.3%) is the more reliable demand signal.
Information and statistics compiled and reported by the Northwest Multiple Listing Service. April 2026 King County Area Statistics Report and Breakouts — Residential Only.
Supply vs. Demand: Where the Buyers Are
Chart 3 — Active Listings vs. Pending Sales vs. Closed Sales · April 2026
The gap between active listings (supply) and pending/closed (demand) tells the real story. W. Bellevue's gap is the defining feature of the market.
Information and statistics compiled and reported by the Northwest Multiple Listing Service.
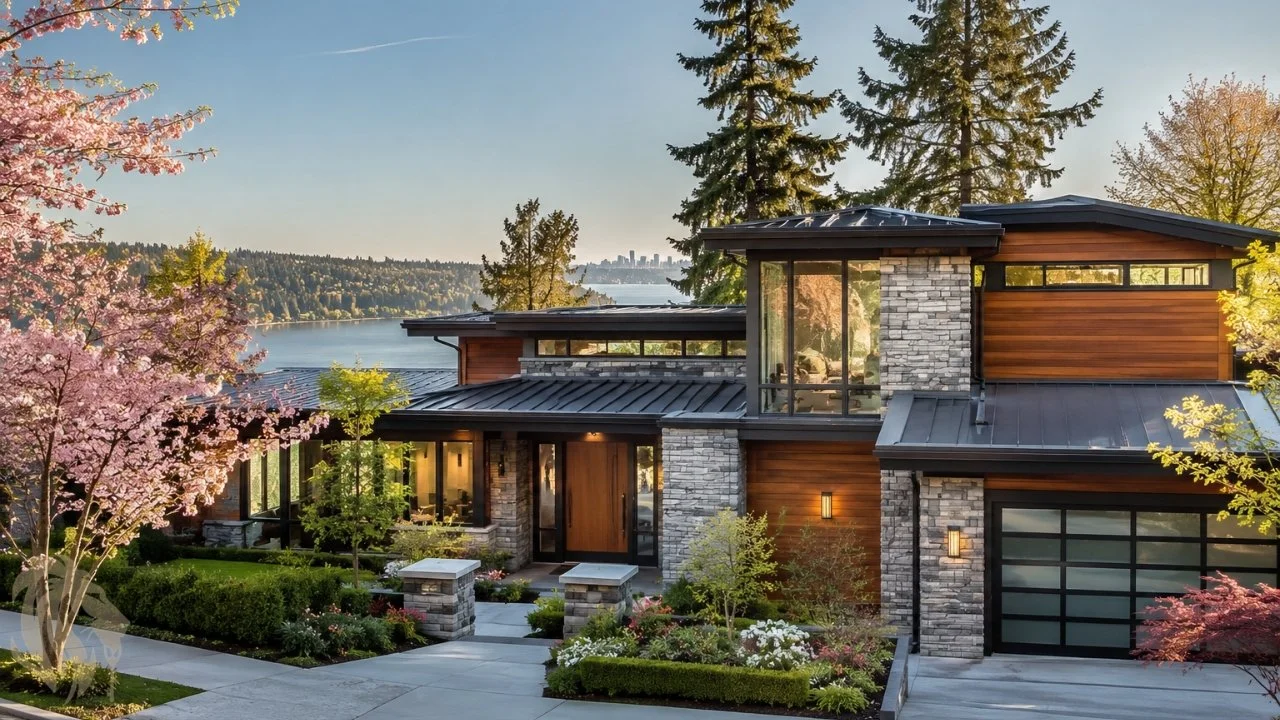
What $3.25M Actually Buys in Each Market
The West Bellevue median is $3,250,000. So $3.25M is the right anchor for this comparison — it puts you at a meaningful position in each market simultaneously.
Median
the Median
the Median
There is no universally correct answer here. The right market depends on what you are optimizing for — school district priority, commute direction, privacy vs. walkability, investment thesis, or simply which address means the most to your family. What this data gives you is clarity on what each market actually looks like right now, so the decision is grounded in reality rather than assumption.
The I-405 Effect: Same City, One Freeway, Different Universe
The most hyperlocal insight in this entire dataset is the one no aggregated "Bellevue market" headline will ever tell you.
West Bellevue (Area 520) and East Bellevue (Area 530) are separated by I-405 — in some places, literally a few hundred meters. They share a city name, a zip code in some cases, and a school district in others. But in April 2026 they are operating as completely different markets:
- Months of supply: 8.41 vs. 3.27
- Median price: $3,250,000 vs. $1,650,000
- Price change: −13.3% vs. −2.9%
- Active listings: 143 vs. 160 (similar count, completely different absorption)
- Pending sales: 16 vs. 48
If you searched "Bellevue homes for sale" on any national platform and looked at the aggregate data, you would get a blended number that obscures this entirely. The Eastside market is not one market. It is nine distinct markets, each with its own supply-demand balance, its own buyer profile, and its own pricing dynamic. Reading the data at the area-code level is the only way to make decisions grounded in what is actually happening.
The advisor insight: When a buyer tells me they are looking in "Bellevue," the first question I ask is which side of I-405. That one question changes every assumption about pricing, leverage, timeline, and strategy. This is not nuance for the sake of nuance — it is the difference between entering a buyer's market with 8 months of supply and a seller's market with 3 months of supply. Those are not the same experience.
Information and statistics compiled and reported by the Northwest Multiple Listing Service. April 2026 King County Area Statistics Report and Breakouts — Residential Only. Area codes reflect NWMLS geographic designations.
Continue Your Research
- Eastside Inventory Is Up 65% — Why Prices Aren't Falling (All 9 Markets) →
- April 2026 Market Update: What the Data Means for Buyers and Sellers →
- Mercer Island Waterfront Homes →
- Bellevue Homes for Sale →
- Eastside Waterfront Homes — Complete Guide →
Eastside Market Report Series
- March 2026: Eastside Luxury Real Estate — What the Data Shows
- April 2026: What the Market Data Actually Means for Buyers and Sellers
- April 2026: Why Inventory Is Rising But Prices Aren't Falling
- May 2026: W. Bellevue vs. Mercer Island vs. E. Bellevue ← You Are Here
- Coming May 31: Is Now a Good Time to Sell a Luxury Home on the Eastside?

Freddy Delgadillo
Eastside Luxury Real Estate Advisor
Realogics Sotheby's International Realty
- 🏆 25+ Years · 350+ Eastside Transactions
- 🎓 Board Trustee · Northwest University
- ⭐ CLHMS · ABR® · CRS · GRI
- 🏡 Bellevue · Mercer Island · Waterfront Specialist
When a Buyer Tells Me "Bellevue," the First Question I Ask Is Which Side of I-405.
That question determines everything — your leverage, your timeline, your competitive position, and your pricing strategy. West Bellevue and East Bellevue share a city name and a freeway. In April 2026 they are operating as entirely different markets, 8.41 months apart in supply. Mercer Island, just across the water, is pointing in a third direction entirely.
I have been navigating the distinction between these markets for 25 years — through every cycle, every rate environment, and every shift in buyer behavior the Eastside has seen. If you are trying to understand where you stand as a buyer or seller in West Bellevue, East Bellevue, or Mercer Island right now, I would genuinely love to have that conversation. The data gives you the map. I give you the route.