
Is Now a Good Time to Sell a Luxury Home on the Eastside?
Seller Advisory · June 2026 · April 2026 NWMLS Data
If you own a luxury home on the Eastside and you've been watching the market wondering whether now is the right time to sell — this post is for you. Not a pitch. Not a headline designed to make you feel urgency. Just an honest read of the April 2026 NWMLS data, applied directly to the six markets where Eastside luxury homeowners actually live.
Here is the most important thing to understand before you read further: the Eastside is not one market. It is six — and right now, each one is at a fundamentally different stage. Mercer Island and East Lake Sammamish are in tight seller's market territory. Kirkland is a precision market. West Bellevue is a buyer's market. If your neighbor sold quickly last spring and you're wondering whether that window is still open, the answer is: it depends entirely on which side of the Eastside you're on.
Here is the data-driven breakdown, city by city.
How to Read This Data:
The Three Numbers That Tell the Story
Before diving into each market, here is a plain-English framework for interpreting what the numbers actually mean. Most agents report data without explaining it. Understanding these three metrics will help you evaluate any market update — not just this one.
Months of Supply
If no new homes listed today, how long to sell everything on the market? Under 3 months = strong seller advantage. 3–6 months = balanced. Over 6 months = buyer's market. This is the single most important number.
Days on Market
How long homes are sitting before going under contract. Short DOM means buyers are active and decisive. Long DOM signals either overpricing or soft demand in that specific tier.
Pending Sales Trend
The forward-looking signal. Rising pending sales mean buyers are writing contracts right now — even if closed sales from 45 days ago tell a different story. It's the best indicator of current momentum.
Months of Supply by Market:
The Eastside at a Glance
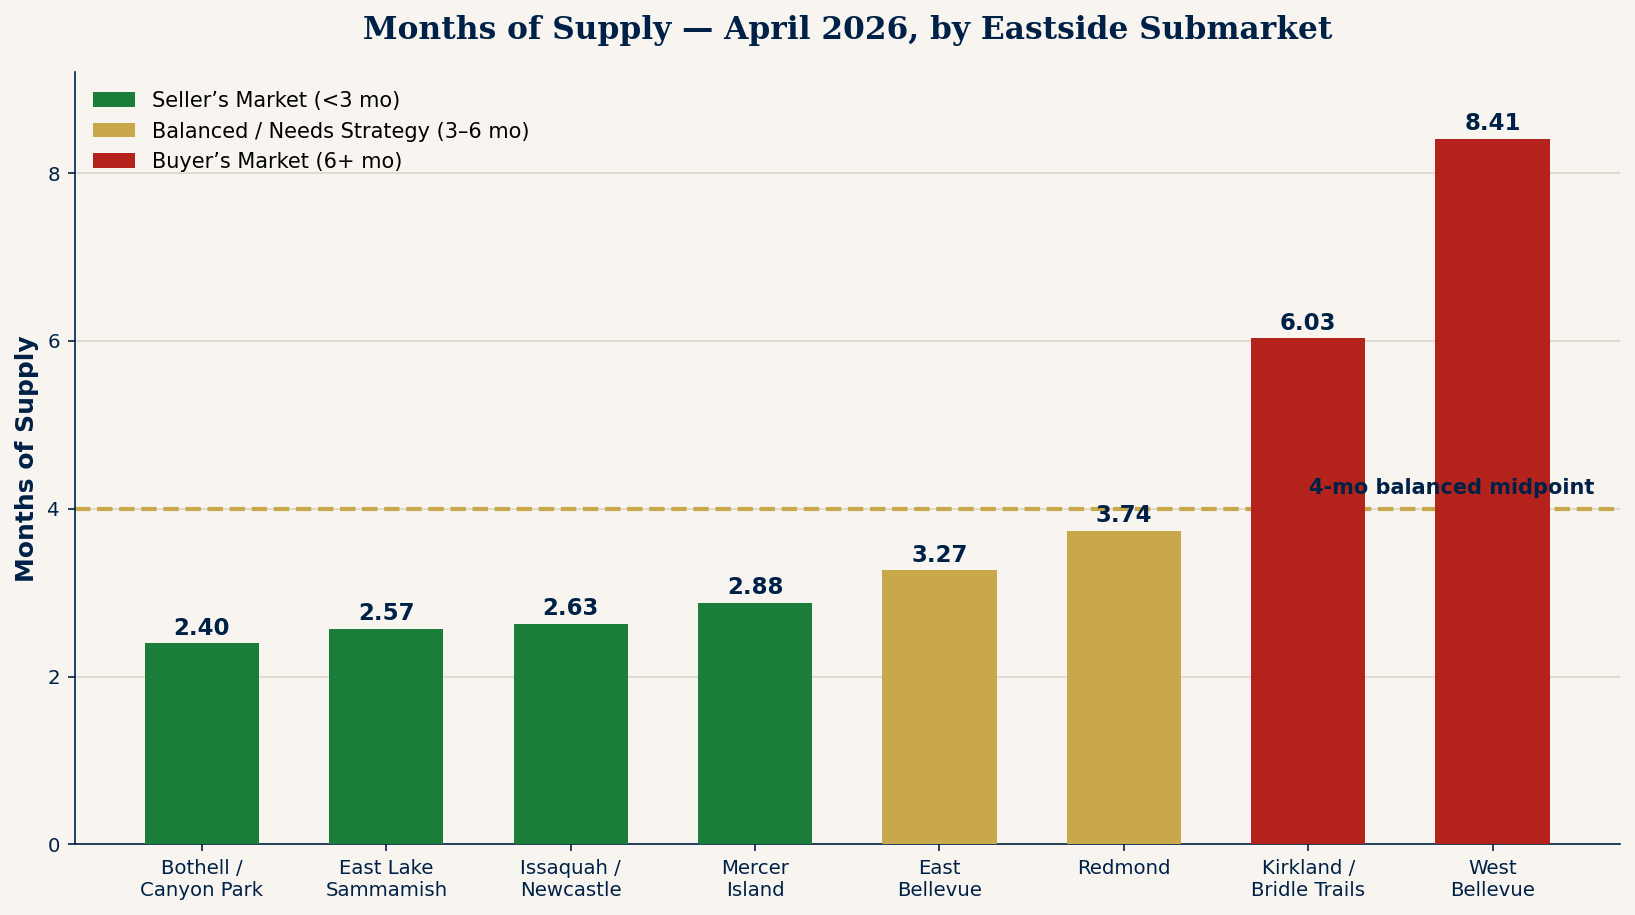
The chart below shows April 2026 months of supply across all six Eastside submarkets. The gold line marks 4 months — the lower boundary of a balanced market. Bars below it favor sellers. Bars above it favor buyers.
Months of Supply — April 2026 NWMLS Data by Eastside Submarket
Market by Market:
Your Honest Seller Verdict
Below is the April 2026 NWMLS data for each Eastside submarket, with a clear signal for sellers in each. Read only the section that applies to your home.
Bothell / Canyon Park — Area 710
2.40 months supply · Median $1,145,000 · DOM 17 · Prices -8.6% YoY
✅ Favorable — Fastest Absorption on the EastsideAt 2.40 months of supply and a 17-day average days on market, Bothell and Canyon Park are moving the fastest of any Eastside submarket right now. Buyers are active and decisive here. The -8.6% year-over-year price figure reflects 2025's elevated comparison point — not a current decline. Sellers with well-maintained homes in this corridor are in the strongest position in the entire market. If you've been waiting for a signal, this data is it.
East Lake Sammamish — Area 540
2.57 months supply · Median $1,595,000 · DOM 23 · Prices -3.3% YoY
✅ Favorable — Low Inventory, Buyer Demand ActiveEast Lake Sammamish holds 2.57 months of supply — firmly in seller's market territory. The 23-day average DOM indicates homes are moving, though buyers here take slightly more time than in Bothell. The -3.3% price change versus last year is a normalization, not a red flag. This submarket serves a specific buyer: families seeking Sammamish lifestyle, lake access, and top-tier schools. That buyer pool remains active. Sellers in this area have leverage — use it with precise pricing and professional presentation.
Issaquah / Newcastle — Area 500
2.63 months supply · Median $1,625,000 · DOM 13 · Closed sales flat YoY
✅ Favorable — Move QuicklyThirteen days on market. That is the fastest DOM on this list and one of the most compelling seller signals in the April data. Issaquah and Newcastle buyers are not browsing — they are buying. At 2.63 months of supply with a $1,625,000 median and flat closed sales (not declining), this is a market that is absorbing well-priced inventory efficiently. For sellers, the message is simple: price correctly, present professionally, and expect an offer in the first two weeks. For more on this submarket, read the April inventory analysis published last month.
Mercer Island — Area 510
2.88 months supply · Median $2,605,000 · Pending sales +33.3% · Prices +4.2% YoY
✅ Favorable — List NowMercer Island is the standout story in the April data. It is the only Eastside submarket showing a price increase year over year — +4.2% — while simultaneously posting a 33.3% surge in pending sales. That combination signals genuine, accelerating buyer demand at the $2.6M+ median price point. Supply is constrained at 2.88 months. Buyers who missed spring listings are actively searching right now. If you own a home on Mercer Island, the window is open. The Mercer Island vs. West Bellevue comparison published last month provides additional context for this market's structural strength.
East Bellevue — Area 530
3.27 months supply · Median $1,650,000 · Prices -2.9% YoY
✅ Favorable — Seller's MarketEast Bellevue sits at 3.27 months of supply — right at the boundary between seller's market and balanced, but still favoring sellers in well-priced segments. The -2.9% year-over-year price movement is modest and reflects broader market normalization. What matters more for sellers here: East Bellevue buyer profiles skew toward Microsoft and Amazon employees who are motivated, pre-qualified, and making decisions based on commute quality and school access — not waiting for rates to drop. Homes that check those boxes are moving at 3.27 months. Homes that do not are the ones pulling the average up.
Redmond — Area 550
3.74 months supply · Median $1,485,000 · DOM 38 · Prices -5.1% YoY
⚠ Needs Strategy — Price CarefullyRedmond's 38-day average DOM is the signal that demands attention here. Buyers are not acting quickly. At 3.74 months of supply, Redmond is technically still a seller's market — but the DOM tells you the buyers who exist are selective and patient. This is a precision market. Homes priced aggressively are sitting. Homes priced at or within 1–2% of true market value are still finding buyers. The strategy for Redmond sellers is not to wait for better conditions — it is to position with surgical accuracy and compelling presentation so that your home stands out from the growing inventory around it.
Kirkland / Bridle Trails — Area 560
6.03 months supply · Median $1,885,000 · Pending sales +34% · Prices -5.8% YoY
⚠ Needs Strategy — Positioning Is EverythingKirkland requires the most nuanced read on this list. At 6.03 months of supply, it sits exactly at the upper boundary of a balanced market — and that 6-month threshold is where leverage shifts from seller to buyer. But here is the number that changes the story: pending sales in Kirkland were up 34% from the prior month. Buyers are coming back. Demand exists. What this market is telling you is that sellers who price at 2022 expectations are the ones creating the backlog — not a lack of buyers. If you are a Kirkland seller, you are not in a bad market. You are in a market that punishes overconfidence and rewards strategy. Professional staging, precise pricing, and a strong digital marketing presence are not optional here — they are the difference between selling and sitting.
West Bellevue — Area 520
8.41 months supply · Median $3,250,000 · Closed sales -13.3% YoY
🔴 Serious Conversation NeededThis is the one part of the Eastside where honesty requires saying: the market conditions are not working in your favor right now. At 8.41 months of supply — nearly 1.5 times the threshold that defines a buyer's market — and closed sales down 13.3% year over year, West Bellevue is a market where buyers have leverage, choice, and patience. That does not mean you cannot sell. It means the homes that are selling are differentiated. They are priced to reflect current reality, not 2021–2022 peak values. They are presented at the absolute highest level. And they are marketed to the specific buyer willing to pay $3.25M+ for a West Bellevue address. If you are a West Bellevue seller, I want to have a real conversation with you — one that begins with the data and ends with a strategy tailored to your specific property and timeline. This market rewards realism and punishes wishful pricing.
Information and statistics compiled and reported by the Northwest Multiple Listing Service. All data reflects April 2026 NWMLS statistics.
What "Needs Strategy" Actually Means:
A Practical Guide for Kirkland and Redmond Sellers
Sellers in Kirkland and Redmond sometimes hear "needs strategy" and translate it as "bad market, wait." That is the wrong interpretation. What it actually means is that your home will not sell itself — and that is fine, because no home sells itself in any market. What changes at 3–6 months of supply is the margin for error. In a 2-month supply market, a slightly overpriced home still gets offers. In a 6-month market, it sits for 60+ days and eventually sells at a lower price than if it had been right from day one.
The Four Pillars of a Precision Listing
1. Pricing within 2% of true market value from day one. Not aspirational. Not "let's try high and see." The first 7 days generate the most buyer attention your listing will ever receive. Starting correctly is non-negotiable.
2. Professional staging and photography. In a market with more choices, buyers eliminate properties online before ever scheduling a showing. The digital presentation is the first showing. It must be exceptional.
3. Targeted marketing to the specific buyer for your home. A $1.9M Kirkland property has a specific buyer profile — tech professional, likely Microsoft or Amazon, specific commute requirements. That buyer needs to be reached directly, not just listed on the MLS and hoped for.
4. Pre-listing preparation. Address the items that buyers will flag during inspection. A home that survives due diligence without surprises closes. A home that produces a long inspection list often loses the buyer at that stage — even in a willing market.
Why June 2026 Specifically
Is a Window Worth Taking Seriously
Seasonal patterns in Eastside luxury real estate are consistent across market cycles, even when broader conditions shift. Here is what the calendar tells you right now.
The spring listing surge — which traditionally peaks in April and May — is winding down. The buyers who were actively searching in that window and did not find the right home are still in the market. They did not disappear. They are more motivated than ever because they went through the spring process, lost out on properties, and are now searching with refined criteria and genuine urgency. This is the buyer who writes strong offers in June.
At the same time, the summer slowdown — which typically hits mid-July through August as families travel and attention shifts — is still six weeks away. That is a meaningful window. Sellers who list in June capture the motivated post-spring buyer before the summer pause reduces the active buyer pool.
For waterfront properties specifically, summer is a uniquely strong selling season — buyers want to experience lake access, dock life, and outdoor entertaining before committing. If your home has waterfront features, listing in June puts buyers on your property during the season when those features are at their most compelling. The Opening Day 2026 waterfront market analysis and the $5M–$20M waterfront guide both provide useful context if your home includes waterfront access.
For a current read on overall Eastside market momentum heading into summer, the May 2026 NWMLS Market Update — published this week — shows buyer engagement metrics rising month-over-month despite elevated rates. The buyers are present. The question is whether your home is positioned to capture them.
Frequently Asked Questions:
Eastside Luxury Home Sellers, 2026
Is it a good time to sell a luxury home on the Eastside in 2026?
It depends entirely on which Eastside submarket your home is in. Markets like Mercer Island, East Lake Sammamish, Issaquah/Newcastle, and Bothell remain strongly favorable for sellers as of April 2026 NWMLS data — all below 3 months of supply. Kirkland and Redmond require a precision strategy but buyers exist. West Bellevue at 8.41 months is a buyer's market requiring a serious strategic conversation. The Eastside is not one market — it is six, and each one is at a different stage right now.
How many months of supply does Kirkland have in 2026?
Kirkland (NWMLS Area 560) had 6.03 months of supply as of April 2026, according to the Northwest Multiple Listing Service. This places Kirkland at the upper boundary of a balanced market. Importantly, Kirkland's pending sales were up 34% from the prior month — indicating buyer demand is returning. Sellers must position with precision to capture that demand.
Is West Bellevue a buyer's market in 2026?
Yes. West Bellevue (NWMLS Area 520) had 8.41 months of supply as of April 2026 — well above the 6-month threshold that defines a buyer's market. The median price was $3,250,000 with closed sales down 13.3% year over year. Homes that are selling are differentiated in condition, presentation, and pricing accuracy. West Bellevue sellers need an honest, strategic conversation before listing.
What is the best time of year to sell a luxury home on the Eastside?
Late spring through early summer — April through June — historically produces the strongest buyer activity and fastest absorption on the Eastside. The window between the end of the spring listing wave and the summer slowdown is particularly valuable. Sellers who list in June capture buyers who missed spring inventory and face fewer direct competitors than peak April listings. For waterfront homes, summer extends the prime window through early September.
How do I know if my Eastside home is priced correctly in 2026?
The clearest signal is days on market relative to your submarket's average. In tight markets like Issaquah/Newcastle (13-day average DOM), a home sitting beyond 21 days is almost certainly overpriced. In markets with more supply, pricing within 2% of true market value is critical. The right price generates showing activity in the first 7 days. If your home has been on market for two weeks with minimal showings, the price — not the buyers — is the issue.

Freddy Delgadillo
Luxury Real Estate Advisor · Realogics Sotheby's International Realty
Your Market. Your Timeline.
Let's Build the Right Strategy.
I didn't just read this data — I've watched these six markets move through every cycle for 25 years. Whether your home is in Mercer Island's momentum or navigating West Bellevue's headwinds, the conversation starts the same place: what does your specific property need to succeed right now? No scripts. No pressure. Just an honest assessment from someone who has closed 350+ Eastside transactions and knows the difference between a market that needs patience and one that needs action. Let's talk.
ABR® · Accredited Buyer's Representative | CRS · Certified Residential Specialist | GRI · Graduate REALTOR® Institute | CLHMS · Certified Luxury Home Marketing Specialist