
Eastside Buyer Advisory: What July 2026 NWMLS Data Means for Your Market
📊 Monthly Eastside Market Advisory
A recurring monthly look at NWMLS data across the Eastside's nine core submarkets. Read June's report →
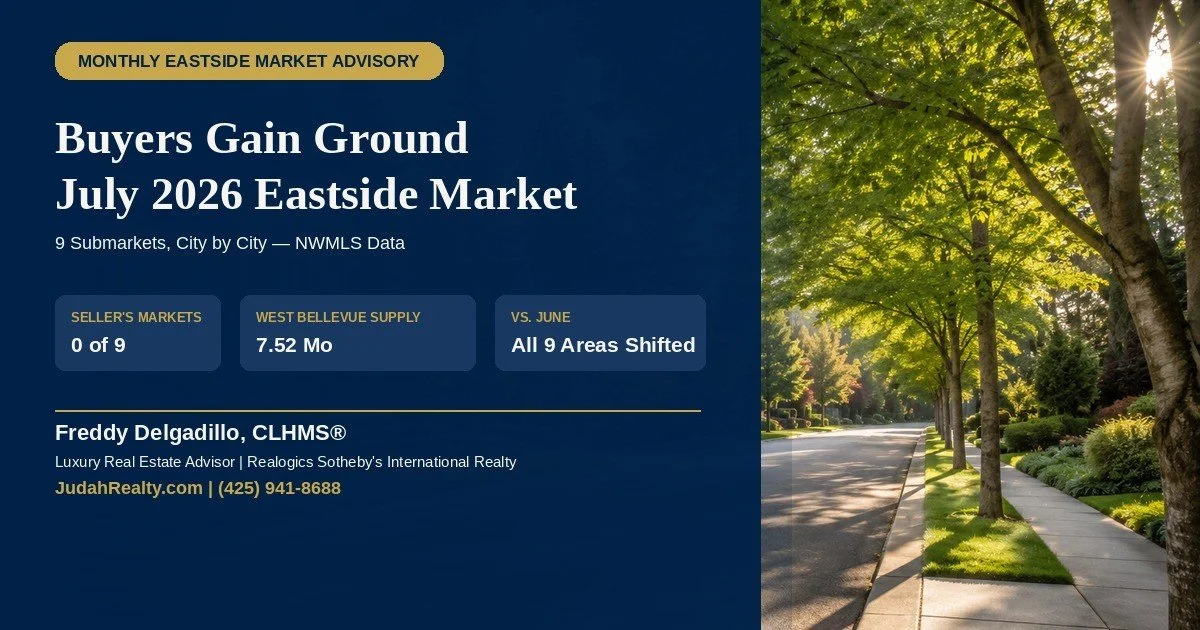
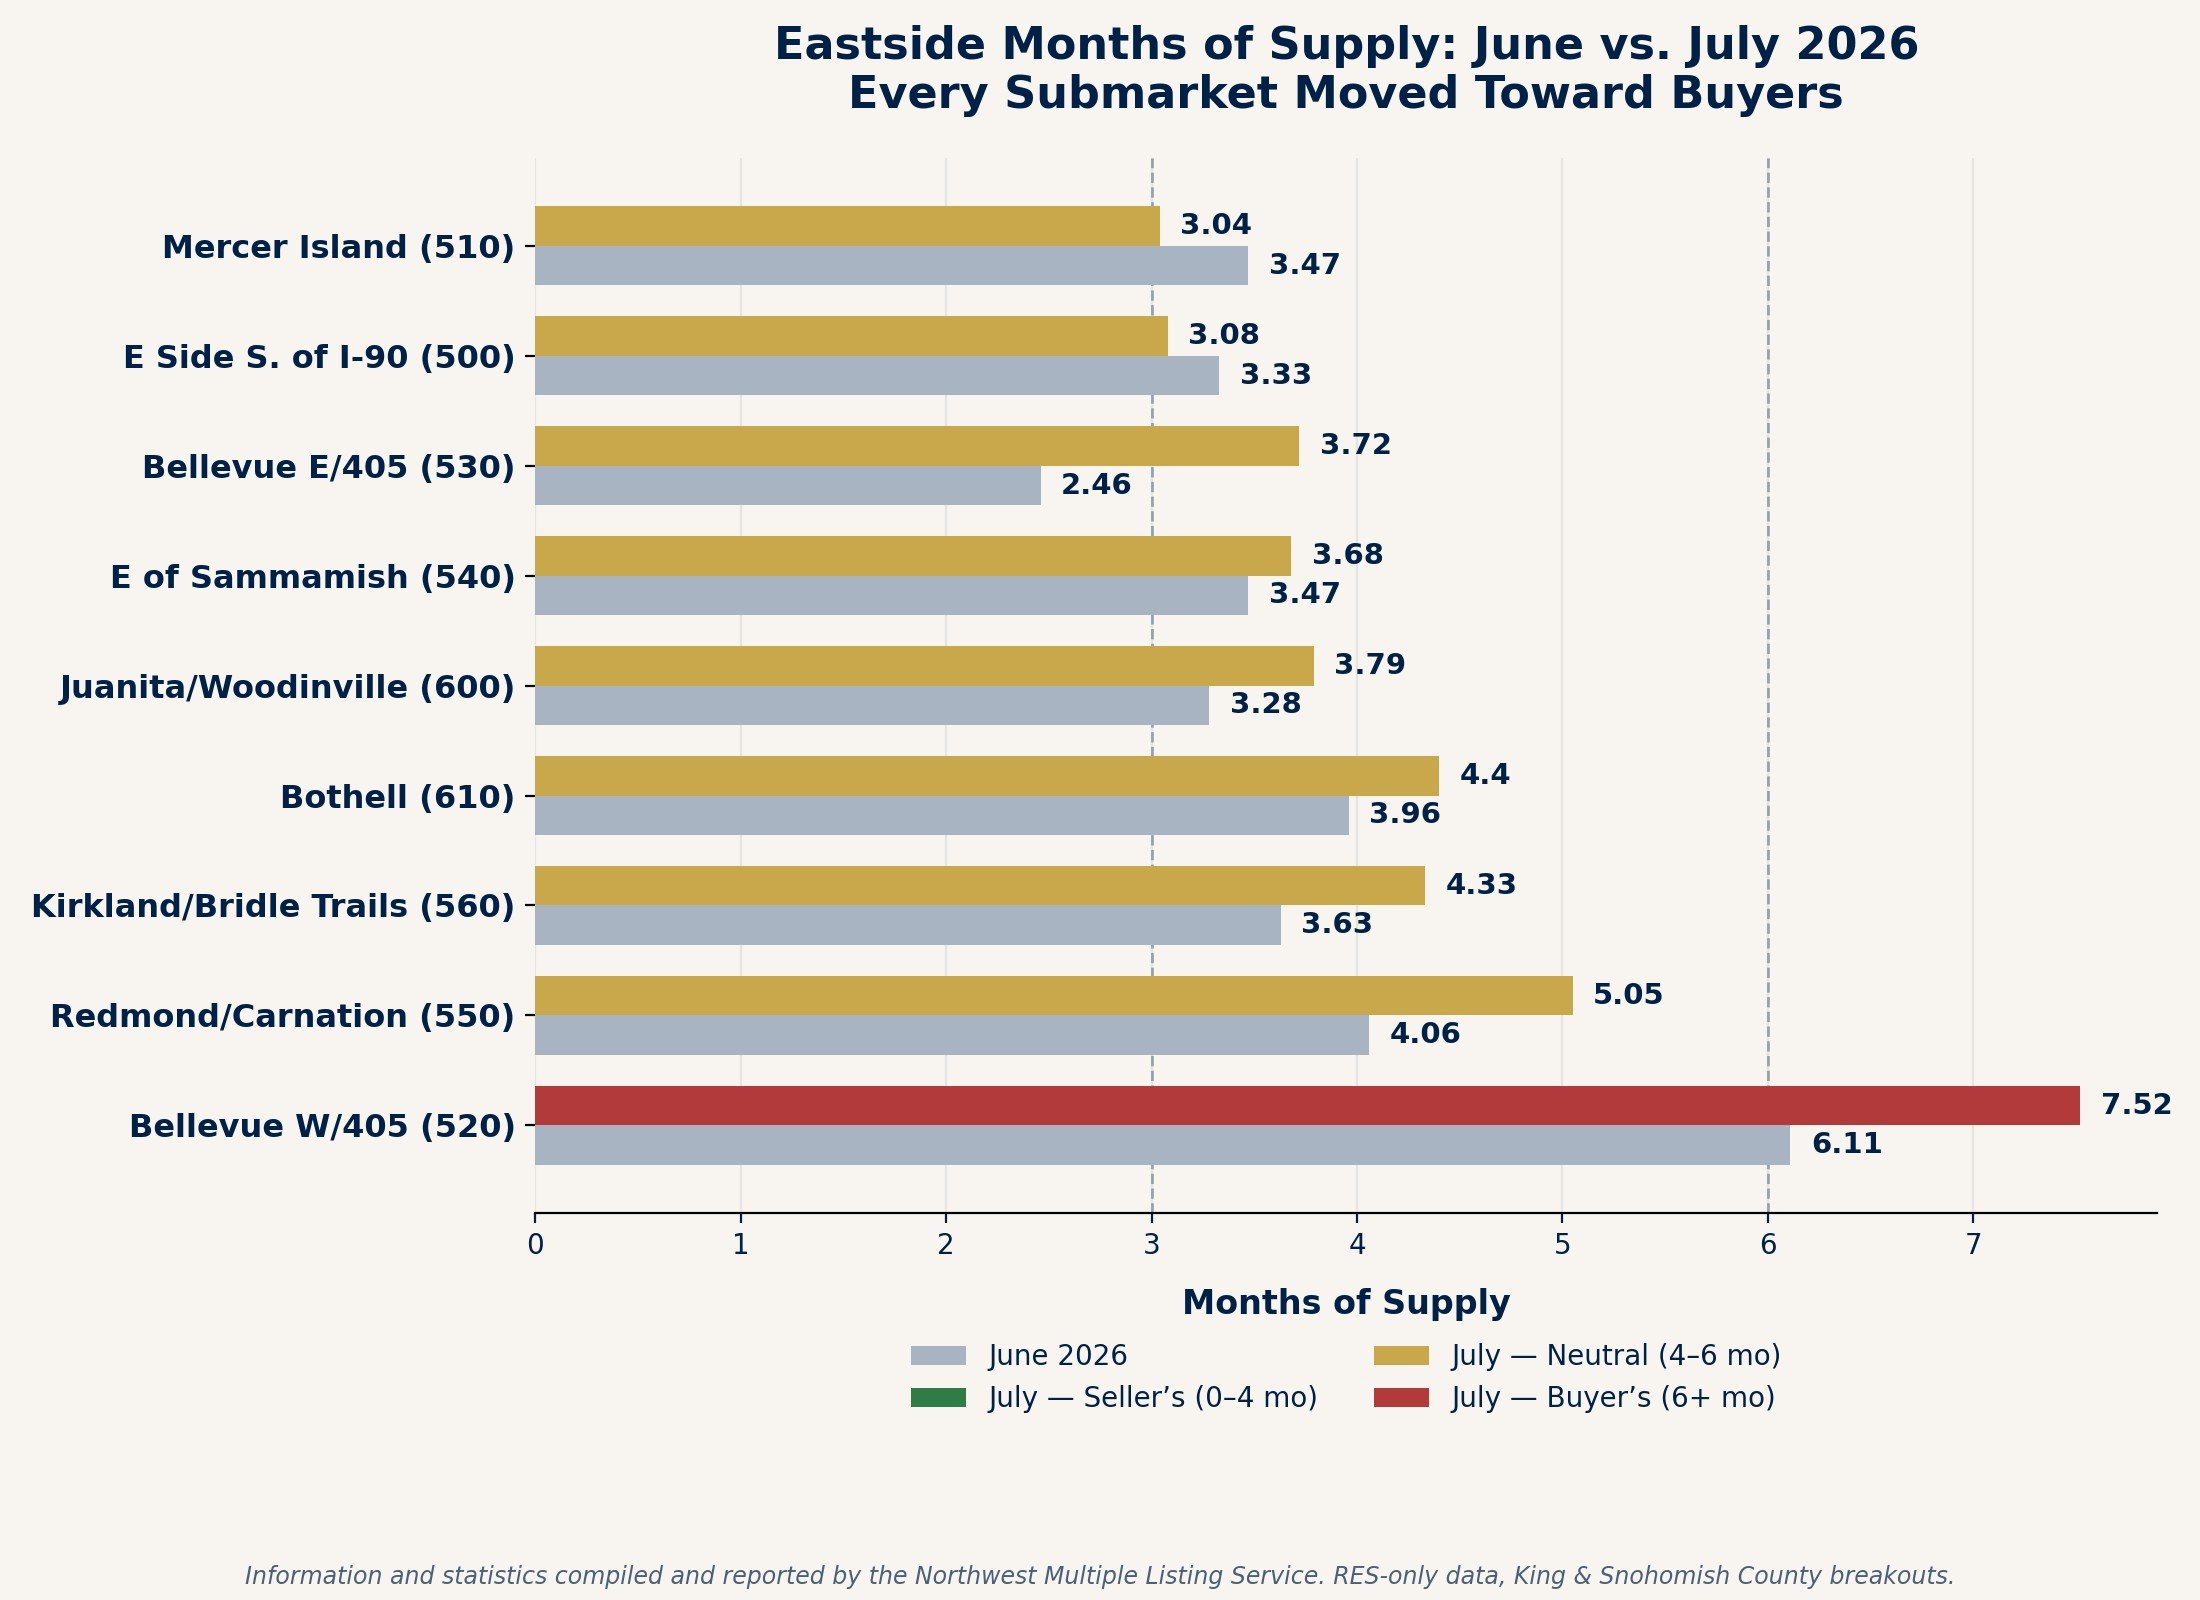
For the first time in this data series, zero of the Eastside's nine tracked submarkets currently favor sellers. Bellevue East of 405 — June's lone seller's market at 2.46 months of supply — moved into balanced territory at 3.72 months in July. West Bellevue's buyer's market deepened further, from 6.11 to 7.52 months of supply. Every area shifted toward buyers month-over-month except Mercer Island and East Side South of I-90, which improved slightly. This tracks with broader regional data: Seattle-area pending home sales fell 15.6% year-over-year in July, the steepest drop of any major U.S. metro, a trend tied in part to tech-sector layoffs affecting buyer confidence.
A Month That Actually Changed the Story
Last month's report noted that most of the Eastside had settled into a balanced range, with one standout seller's market in Bellevue East. July's data tells a genuinely different story — not a dramatic crash, but a clear, broad-based shift. Every single one of the nine Eastside submarkets we track moved in a softer direction month-over-month, with only two exceptions. That matters for buyers who've been waiting on the sidelines. More inventory, longer days on market, and softening prices in several submarkets mean real negotiating room that simply wasn't there earlier this year — including in some of the Eastside's most competitive luxury corridors.

Why This Is Happening: The Bigger Picture
This shift isn't happening in isolation. A recent GeekWire report, citing Redfin data, found that Seattle-area pending home sales dropped 15.6% year-over-year in July — the steepest decline among major U.S. metro areas, ahead of markets like Houston and Phoenix. Real estate agents quoted in the piece pointed to ongoing tech-sector layoffs at major regional employers as a key factor, noting that even workers who remain employed have grown more cautious about taking on large mortgages amid broader economic uncertainty. NWMLS's own July statewide snapshot reinforces this: active listings rose nearly 20% year-over-year statewide, while closed sales and median prices both declined. Mortgage rates have also been trending in the wrong direction for buyer affordability — averaging 6.1% in Q1 2026, rising to 6.4% by Q2, and now sitting above 6.5% as of July. For buyers, this combination of more inventory, more time to decide, and sellers facing real competition adds up to the most favorable conditions the Eastside has seen so far this year.
Market by Market: June vs. July
Bellevue – West of 405 — Area 520
7.52 months supply (up from 6.11 in June) · Median $3,300,000 · -23.22% YoY · New listings +27.1% YoY
🔴 Strongest Buyer Opportunity on the Eastside
West Bellevue's buyer's market deepened meaningfully month-over-month. This ultra-luxury corridor — including Medina, Clyde Hill, Yarrow Point, and Hunts Point — now carries nearly two and a half months more inventory than a true balanced market, with pricing down over 23% year-over-year. For buyers with the means to compete at this tier, this is the most negotiating leverage this market has offered in this data series.
Redmond / Carnation — Area 550
5.05 months supply (up from 4.06 in June) · Median $1,395,000 · +1.82% YoY · Closed sales -14.89% YoY
⚠ Approaching Buyer's Market Territory
Redmond crossed further past the balanced midpoint this month, edging closer to the 6-month buyer's threshold. Closed sales pulled back notably even as prices held nearly flat — a sign that homes here are taking real strategy to move, and buyers have room to negotiate on terms.
Bellevue – East of 405 — Area 530
3.72 months supply (up from 2.46 in June) · Median $1,660,000 · +6.75% YoY · Closed sales -25.37% YoY
⚠ No Longer a Seller's Market
This is the month's most notable individual shift. East Bellevue was the Eastside's only clear seller's market in June; it's now balanced, with closed sales down over 25% year-over-year even as pricing held up. Sellers here should recalibrate expectations from earlier this year.
Kirkland / Bridle Trails — Area 560
4.33 months supply (up from 3.63 in June) · Median $1,995,000 · -3.39% YoY · Closed sales -1.79% YoY
⚠ Balanced, Pricing Cooled from June's Spike
Kirkland's median price swung from a striking +22.9% year-over-year gain in June's report to a -3.39% decline in July. Worth reading with some caution — Kirkland's closed-sales count is modest enough that a handful of high-value transactions can swing the month-over-month median substantially. Directionally, though, this market has clearly cooled from its earlier-year heat.
Bothell — Area 610
4.40 months supply (up from 3.96 in June) · Median $1,062,500 · -9.65% YoY · Closed sales -14.78% YoY
⚠ Balanced, Softening Further
Bothell continues drifting toward buyer-favorable territory, with price and closed sales both down meaningfully year-over-year. Buyers focused on relative affordability should have real room to negotiate here.
Juanita / Woodinville — Area 600
3.79 months supply (up from 3.28 in June) · Median $1,260,000 · -2.44% YoY · New listings +57.6% YoY
⚠ Balanced, Sharp New-Listing Growth
New listings surged nearly 58% year-over-year here, the largest increase of any Eastside area this month. That flood of new competition among sellers translates directly into more choice — and more leverage — for buyers touring this submarket.
East of Lake Sammamish — Area 540
3.68 months supply (up slightly from 3.47 in June) · Median $1,420,000 · -7.97% YoY · New listings +49.4% YoY
⚠ Balanced, Still the Most New Inventory
This area continues to see the strongest wave of new listings on the Eastside, and prices have softened accordingly. Genuinely balanced conditions — good for buyers wanting selection without the extremes seen in West Bellevue.
East Side, South of I-90 — Area 500
3.08 months supply (improved from 3.33 in June) · Median $1,660,000 · -4.32% YoY · New listings +21.6% YoY
✅ One of Two Areas That Improved
This area actually tightened slightly month-over-month, bucking the broader trend. Still a balanced market, but one of the few showing renewed strength.
Mercer Island — Area 510
3.04 months supply (improved from 3.47 in June) · Median $2,505,000 · -3.65% YoY · Pending sales -20% YoY
✅ Tightened Despite Softer Pending Sales
Mercer Island improved month-over-month even as pending sales pulled back year-over-year — a market holding up better than most of the Eastside right now, likely reflecting its limited, hard-to-replace inventory.
June vs. July at a Glance
| Area | June Supply | July Supply | Direction |
|---|---|---|---|
| Mercer Island (510) | 3.47 | 3.04 | ↓ Improved |
| E Side S. of I-90 (500) | 3.33 | 3.08 | ↓ Improved |
| Bellevue E/405 (530) | 2.46 | 3.72 | ↑ Worsened |
| E of Sammamish (540) | 3.47 | 3.68 | ↑ Worsened |
| Juanita/Woodinville (600) | 3.28 | 3.79 | ↑ Worsened |
| Bothell (610) | 3.96 | 4.40 | ↑ Worsened |
| Kirkland/Bridle Trails (560) | 3.63 | 4.33 | ↑ Worsened |
| Redmond/Carnation (550) | 4.06 | 5.05 | ↑ Worsened |
| Bellevue W/405 (520) | 6.11 | 7.52 | ↑ Worsened |
Information and statistics compiled and reported by the Northwest Multiple Listing Service. RES-only data.
Frequently Asked Questions
Is it a good time to buy a home on the Eastside in 2026?
As of July 2026 NWMLS data, buyers have more leverage across the Eastside than at any point so far this year. Zero of nine tracked submarkets currently favor sellers, and West Bellevue (Area 520) has moved further into buyer's market territory at 7.52 months of supply, up from 6.11 months in June.
Is Bellevue still a seller's market in 2026?
No, not currently. Bellevue East of 405 (Area 530) was the Eastside's only seller's market in June 2026 at 2.46 months of supply, but moved to a balanced 3.72 months in July. Bellevue West of 405 (Area 520) remains a clear buyer's market at 7.52 months of supply.
Why is the Seattle-area housing market slowing down in 2026?
According to Redfin data reported by GeekWire, Seattle-area pending home sales fell 15.6% year-over-year in July 2026, the steepest drop of any major U.S. metro. The slowdown has been linked to tech-sector layoffs at major employers including Amazon and Microsoft, which have made even employed tech workers more cautious about taking on large mortgages.
How much has Eastside housing inventory changed from June to July 2026?
Every one of the nine Eastside submarkets tracked saw months-of-supply increase or hold roughly flat from June to July 2026, except Mercer Island and East Side South of I-90, which improved slightly. West Bellevue saw the largest shift, rising from 6.11 to 7.52 months of supply.
What is the current mortgage rate trend in Washington State?
Mortgage rates have trended upward through 2026 rather than continuing to ease. Rates averaged 6.1% in Q1 2026, rose to 6.4% by Q2, and averaged over 6.5% in July 2026 according to NWMLS's July Market Snapshot, continuing to weigh on buyer affordability.
🏆 500+ Eastside Transactions · 🎓 CLHMS · CRS · ABR · GRI · CSP
⭐ 425 Magazine & Seattle Times Featured · 🌐 Bilingual English/Spanish

Whichever Side of the Table You're On, Timing Matters Right Now
Buyers are seeing leverage across nearly every Eastside submarket for the first time this year. Sellers need a sharper, more honest strategy than a few months ago.
Let's talk about exactly what these numbers mean for your specific goals — with 25+ years and 500+ Eastside transactions behind the conversation.
📞 (425) 941-8688 ·
✉ freddy@judahrealty.com
10237 Main Street, Bellevue, WA 98004