
Monthly Eastside Market Advisory: September 2026 NWMLS Data
Eastside Market Advisory: September 2026 NWMLS Data Shows Buyers Gaining Leverage

THE SHORT ANSWER
September 2026 NWMLS data shows buyers gaining leverage. Across nine Eastside areas, active single-family listings rose 47.4% year over year while pending sales fell 18.9%. Inventory across the NWMLS region hit its highest September level since 2014 (4.44 months). West Bellevue (8.32 months) is the Eastside's only buyer's market; the other eight areas range from 3.27 to 5.59 months, a balanced range, and none is under 3 months.
What Changed in September: The NWMLS Regional Picture
NWMLS reports that buyers across the service area had more homes to choose from in September than at any point since September 2014. Active listings rose 24.5% to 24,965, pending sales fell 15.1% to 6,231, and closed sales dropped 8.9% to 5,623, the lowest for any September since at least 2014. Months of inventory reached 4.44, the highest since February 2014, up from 2.8 in March.
The NWMLS-wide median price was $625,000, down 0.9% from a year ago. September's drop in pending sales was the sharpest year-over-year decline of 2026, and more than double August's 6.5% decline. For every 100 new listings added, buyers went under contract on about 62 homes, compared with about 80 a year earlier.
Washington Center for Real Estate Research director Steven Bourassa describes this as "downward stickiness": prices tend to rise quickly in strong markets but fall slowly in weak ones, because sellers can often wait rather than accept a lower price.
Why Mortgage Rates Matter Here
The average 30-year fixed rate climbed from 6.71% on September 3 to 7.03% on September 24, then reached 7.28% in the first week of October, according to Freddie Mac as reported by NWMLS. A higher rate raises the monthly payment on the same loan, which narrows the pool of buyers at any given price. A smaller buyer pool likely contributes to pending sales falling while new listings kept arriving.
Eastside Snapshot: Nine Areas Combined
Combining the nine NWMLS Eastside map areas (single-family only), active listings rose 47.4% year over year, from 1,581 to 2,330. Pending sales fell 18.9% (693 to 562), and closed sales fell 8.6% (579 to 529). In plain terms, more homes are for sale and fewer are going under contract, which is what pushes months of supply up.
Four Months of Supply, Nine Areas
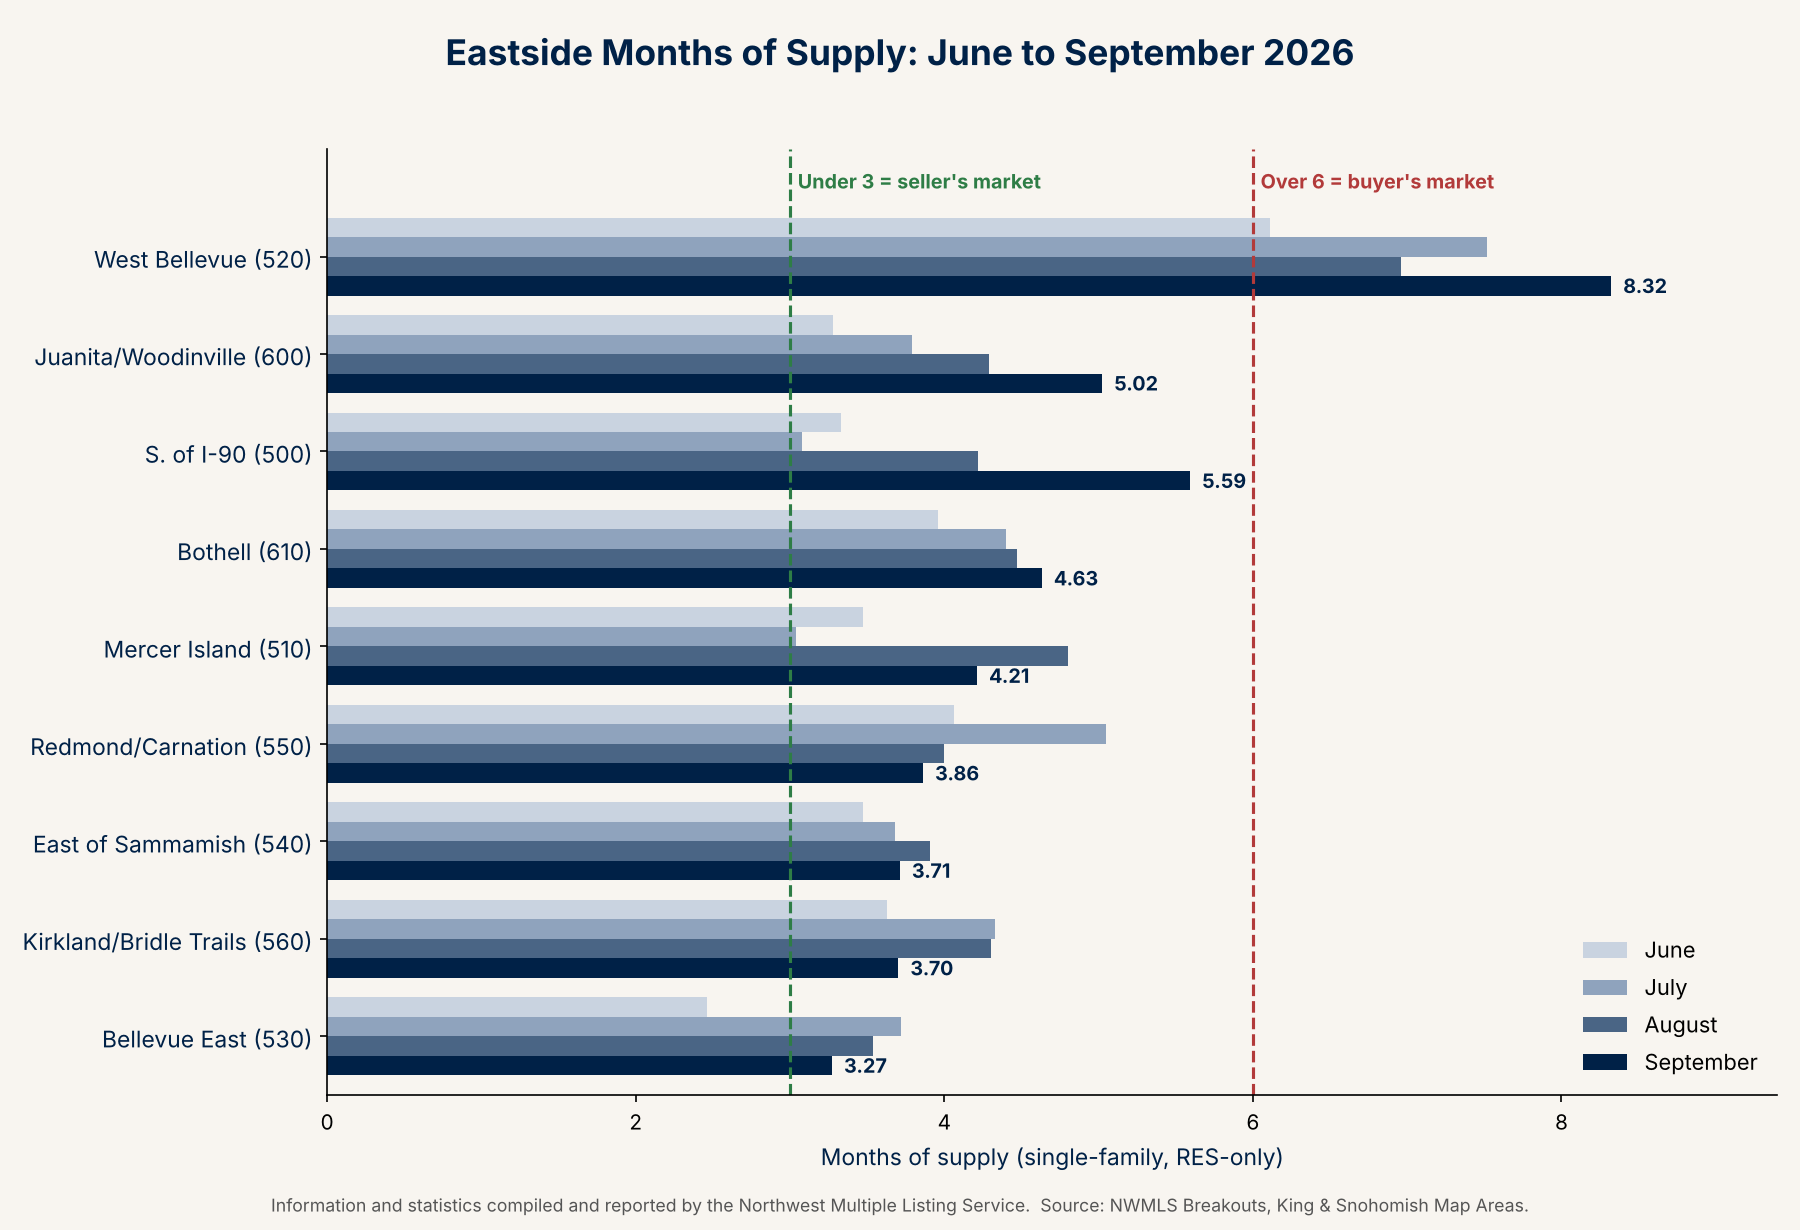
The chart below tracks months of supply, meaning how long it would take to sell current inventory at the current sales pace, from June through September. West Bellevue, South of I-90, and Juanita/Woodinville moved the most; Mercer Island, Kirkland/Bridle Trails, Redmond/Carnation, East of Sammamish, and Bellevue East eased back slightly from August.
City-by-City Breakdown
| Area | Sept Mo. Supply | Aug | Active vs. Sep 2025 | Pending vs. Sep 2025 | Median Price | vs. Sep 2025 | Condition |
|---|---|---|---|---|---|---|---|
| West Bellevue (520) | 8.32 | 6.96 | +45.0% | +4.2% | $2,720,000 | -26.3% | Buyer's |
| S. of I-90 (500) | 5.59 | 4.22 | +61.6% | -42.7% | $1,418,919 | -12.1% | Balanced |
| Juanita/Woodinville (600) | 5.02 | 4.29 | +49.2% | -4.1% | $1,150,000 | -6.1% | Balanced |
| Bothell (610) | 4.63 | 4.47 | +39.9% | -26.3% | $1,104,500 | -9.8% | Balanced |
| Mercer Island (510) | 4.21 | 4.80 | +31.1% | -25.0% | $2,325,000 | -11.4% | Balanced |
| Redmond/Carnation (550) | 3.86 | 4.00 | +26.0% | -27.9% | $1,184,000 | -12.3% | Balanced |
| East of Sammamish (540) | 3.71 | 3.91 | +78.0% | +5.7% | $1,300,000 | -12.6% | Balanced |
| Kirkland/Bridle Trails (560) | 3.70 | 4.30 | +27.0% | -24.6% | $1,900,000 | -17.4% | Balanced |
| Bellevue East (530) | 3.27 | 3.54 | +51.8% | -36.3% | $1,550,000 | 0.0% | Balanced |
Single-family (RES-only) data. Months of supply: under 3 = seller's market, 3 to 6 = balanced, over 6 = buyer's market. Median prices in areas with fewer than 30 closings can swing sharply from month to month. Information and statistics compiled and reported by the Northwest Multiple Listing Service.

What Each Area Is Telling Us
West Bellevue (8.32 months) is the Eastside's lone buyer's market and has been over 6 months every month since June. Only 19 homes closed in September, so the median price swing (-26.3%) reflects which homes happened to sell as much as value changes.
South of I-90 (5.59) and Juanita/Woodinville (5.02) loosened the most since the summer. South of I-90 pending sales fell 42.7%, the steepest drop of the nine areas.
Mercer Island (4.21), Kirkland/Bridle Trails (3.70), Redmond/Carnation (3.86) and East of Sammamish (3.71) improved from August. Kirkland closed 61 homes, up 24.5% from a year ago, and East of Sammamish pending sales rose 5.7%, one of only two areas with more contracts than last September.
Bellevue East (3.27) remains the tightest of the nine, though no area dropped below 3 months in September, so there are no seller's markets on the Eastside this month.
Bothell (4.63) is balanced. NWMLS reports Snohomish County inventory up 44.2%, the largest increase of the three core Puget Sound counties.
Condos Are Softer Than Houses
Across the NWMLS region, condo pending sales fell 22.7% versus 13.9% for single-family homes, and condos carried 6.29 months of inventory versus 4.20 for houses. In King County, condos had 7.05 months and the median condo price fell 6.0% to $496,000. On the Eastside, condo months of supply ran 7.60 in Bellevue East, 8.47 in West Bellevue, 7.45 in Juanita/Woodinville, and 6.75 South of I-90.
What This Means for Sellers
Price to today's closed sales, not last spring's. Eight of nine areas posted a lower median than a year ago, and Bellevue East was flat at $1,550,000. Homes that are priced accurately and presented well continue to sell; showings per listing fell to 4.2 across the NWMLS region from 5.2, so each showing matters more.
What This Means for Buyers
You have the most selection since 2014 and more room to negotiate on price, repairs, and timing. Across the NWMLS region, 74.7% of NWMLS listings qualified for at least one down payment assistance program in September, and NWMLS.com flags them with a "Down Payment Help" label. A rate-and-payment review with a lender before you tour will tell you what each price point costs per month.
Frequently Asked Questions
What does the September 2026 NWMLS data say about the Eastside housing market?
Across nine Eastside map areas, active single-family listings rose 47.4% year over year (2,330 vs. 1,581) while pending sales fell 18.9% (562 vs. 693), according to NWMLS. Across the NWMLS service area, active listings reached 24,965, the highest September inventory since 2014, and months of inventory hit 4.44.
Is the Eastside a buyer's market or a seller's market right now?
It depends on the city. Using NWMLS months of supply, West Bellevue (8.32 months) is a buyer's market, Bellevue East (3.27) is the tightest area, and the other seven areas sit between 3.7 and 5.6 months, which is a balanced range. None of the nine areas was under 3 months in September.
Which Eastside areas have the most inventory in September 2026?
South of I-90 (up from 3.33 months in June to 5.59) and Juanita/Woodinville (3.28 to 5.02) rose the most since June, and West Bellevue (8.32 months) remains the highest. Mercer Island, Kirkland/Bridle Trails, Redmond/Carnation, and East of Sammamish each held between 3.7 and 4.2 months.
How are rising mortgage rates affecting Eastside home sales?
NWMLS reports the average 30-year fixed rate climbed from 6.71% on September 3 to 7.03% on September 24, then 7.28% in the first week of October, per Freddie Mac. NWMLS-wide pending sales fell 15.1% in September, the sharpest year-over-year decline of 2026.
What should Eastside sellers and buyers do in this market?
Sellers benefit from pricing to current NWMLS comparable sales rather than last spring's results, since 8 of 9 Eastside areas posted lower median prices than a year ago. Buyers have more selection and more negotiating room than at any point since 2014. A neighborhood-level review of months of supply is the best starting point for both.
Information and statistics compiled and reported by the Northwest Multiple Listing Service. Data reflects single-family residential (RES-only) activity for September 2026 unless noted; combined nine-area totals are calculated from NWMLS area rows. This article is for educational purposes and is not financial advice.

500+ Eastside Transactions
CLHMS · CRS · ABR · GRI · CSP
425 Magazine & Seattle Times Featured
Bilingual English/Spanish
YOUR EASTSIDE MARKET ADVISOR
Let's Read Your Market Together
Whether you're thinking about selling or ready to buy, I'll pull the NWMLS numbers for your exact neighborhood so you can see where leverage sits today, not where it sat last spring.
Sellers get a pricing strategy built on current comparable sales. Buyers get a clear view of inventory, negotiating room, and timing.
Schedule a Consultation Call Freddy📞 Call/Text: (425) 941-8688
✉️ freddy@judahrealty.com
🌐 JudahRealty.com
📍 10237 Main Street, Bellevue, WA 98004