
Monthly Eastside Market Advisory #5: October 2026 NWMLS Data
Eastside Market Advisory: October 2026 NWMLS Data Shows More Listings, Fewer Contracts
📊 Monthly Eastside Market Advisory · Read September's report →
THE SHORT ANSWER
In October 2026, active single-family listings across nine Eastside areas were up 48.2% from a year earlier, while pending sales fell 17.9%. Combined months of supply held at 4.39, nearly the same as September. Eight areas were balanced, West Bellevue was the only buyer's market at 9.06 months, and Kirkland/Bridle Trails had the biggest jump, from 3.70 to 5.91 months.
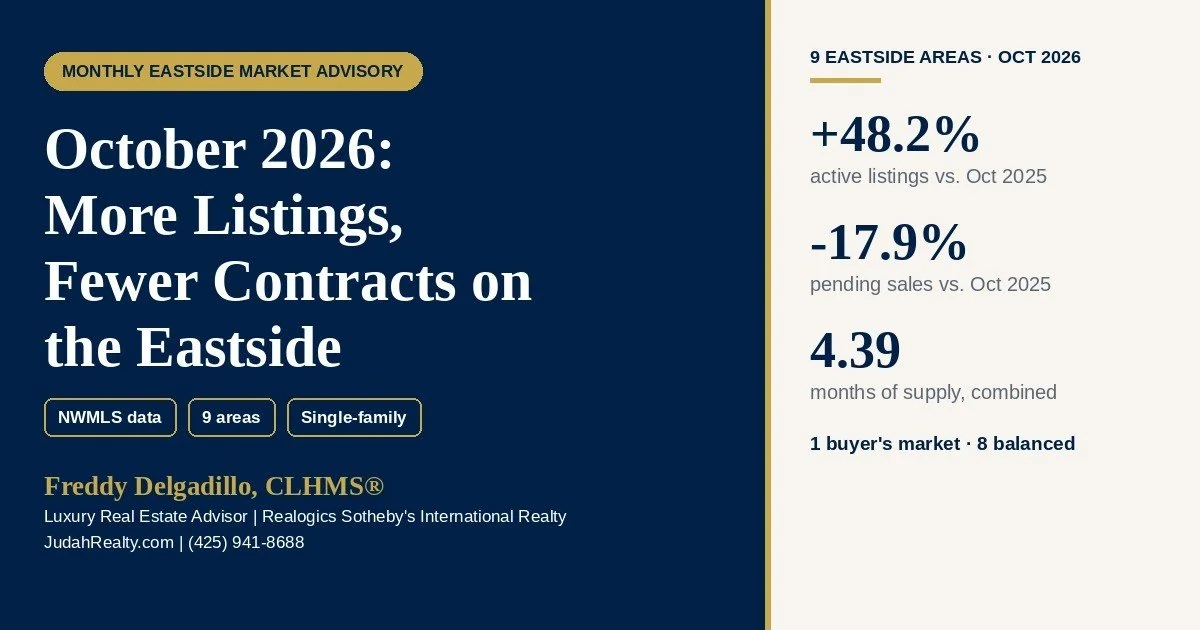
This is the fifth report in my monthly series tracking months of supply across nine Eastside areas, using single-family NWMLS data. The big picture: buyers have many more choices than a year ago, fewer homes are going under contract, and the overall balance barely moved from September.
What Changed in October: The NWMLS Regional Picture
- Supply: months of inventory across the NWMLS service area reached 4.41, the highest for any October since at least 2014.
- Listings: active listings rose 25.2% from a year earlier to 23,519. New listings were unchanged at 7,991, so the growth reflects slower sales rather than more homes coming to market.
- Sales: pending sales fell 17.8% to 5,541, the fewest for any October since at least 2014. Closed sales fell 14.3% to 5,332.
- Prices: the overall median was $620,000, down 3.1%. In King County, the single-family median was $925,000, down 7.2%.
Why Mortgage Rates Matter Here
Freddie Mac's 30-year average peaked at 7.40% in the weeks of October 8 and October 15, the highest weekly average in more than a year. It eased to 7.18% as of November 5, 2026, compared with 6.22% a year earlier. In the NWMLS release, Steven Bourassa, director of the Washington Center for Real Estate Research, noted that 30-year rates averaged 7.33% in October compared with 6.86% in September.
A higher rate raises the monthly payment on the same price, which can slow how quickly buyers commit. That is consistent with what we see below, though the data alone cannot prove the cause.
Eastside Snapshot: Nine Areas Combined
| Nine Eastside areas, single-family | October 2026 | October 2025 | Change |
|---|---|---|---|
| Active listings | 2,149 | 1,450 | +48.2% |
| Pending sales | 474 | 577 | −17.9% |
| Closed sales | 490 | 598 | −18.1% |
| Months of supply (combined) | 4.39 | 2.42 | +1.97 months |
Compared with September, active listings across the nine areas fell 7.8%, from 2,330 to 2,149, while closed sales fell from 529 to 490. Because both moved down together, combined months of supply stayed at about 4.4.
Five Months of Supply, Nine Areas
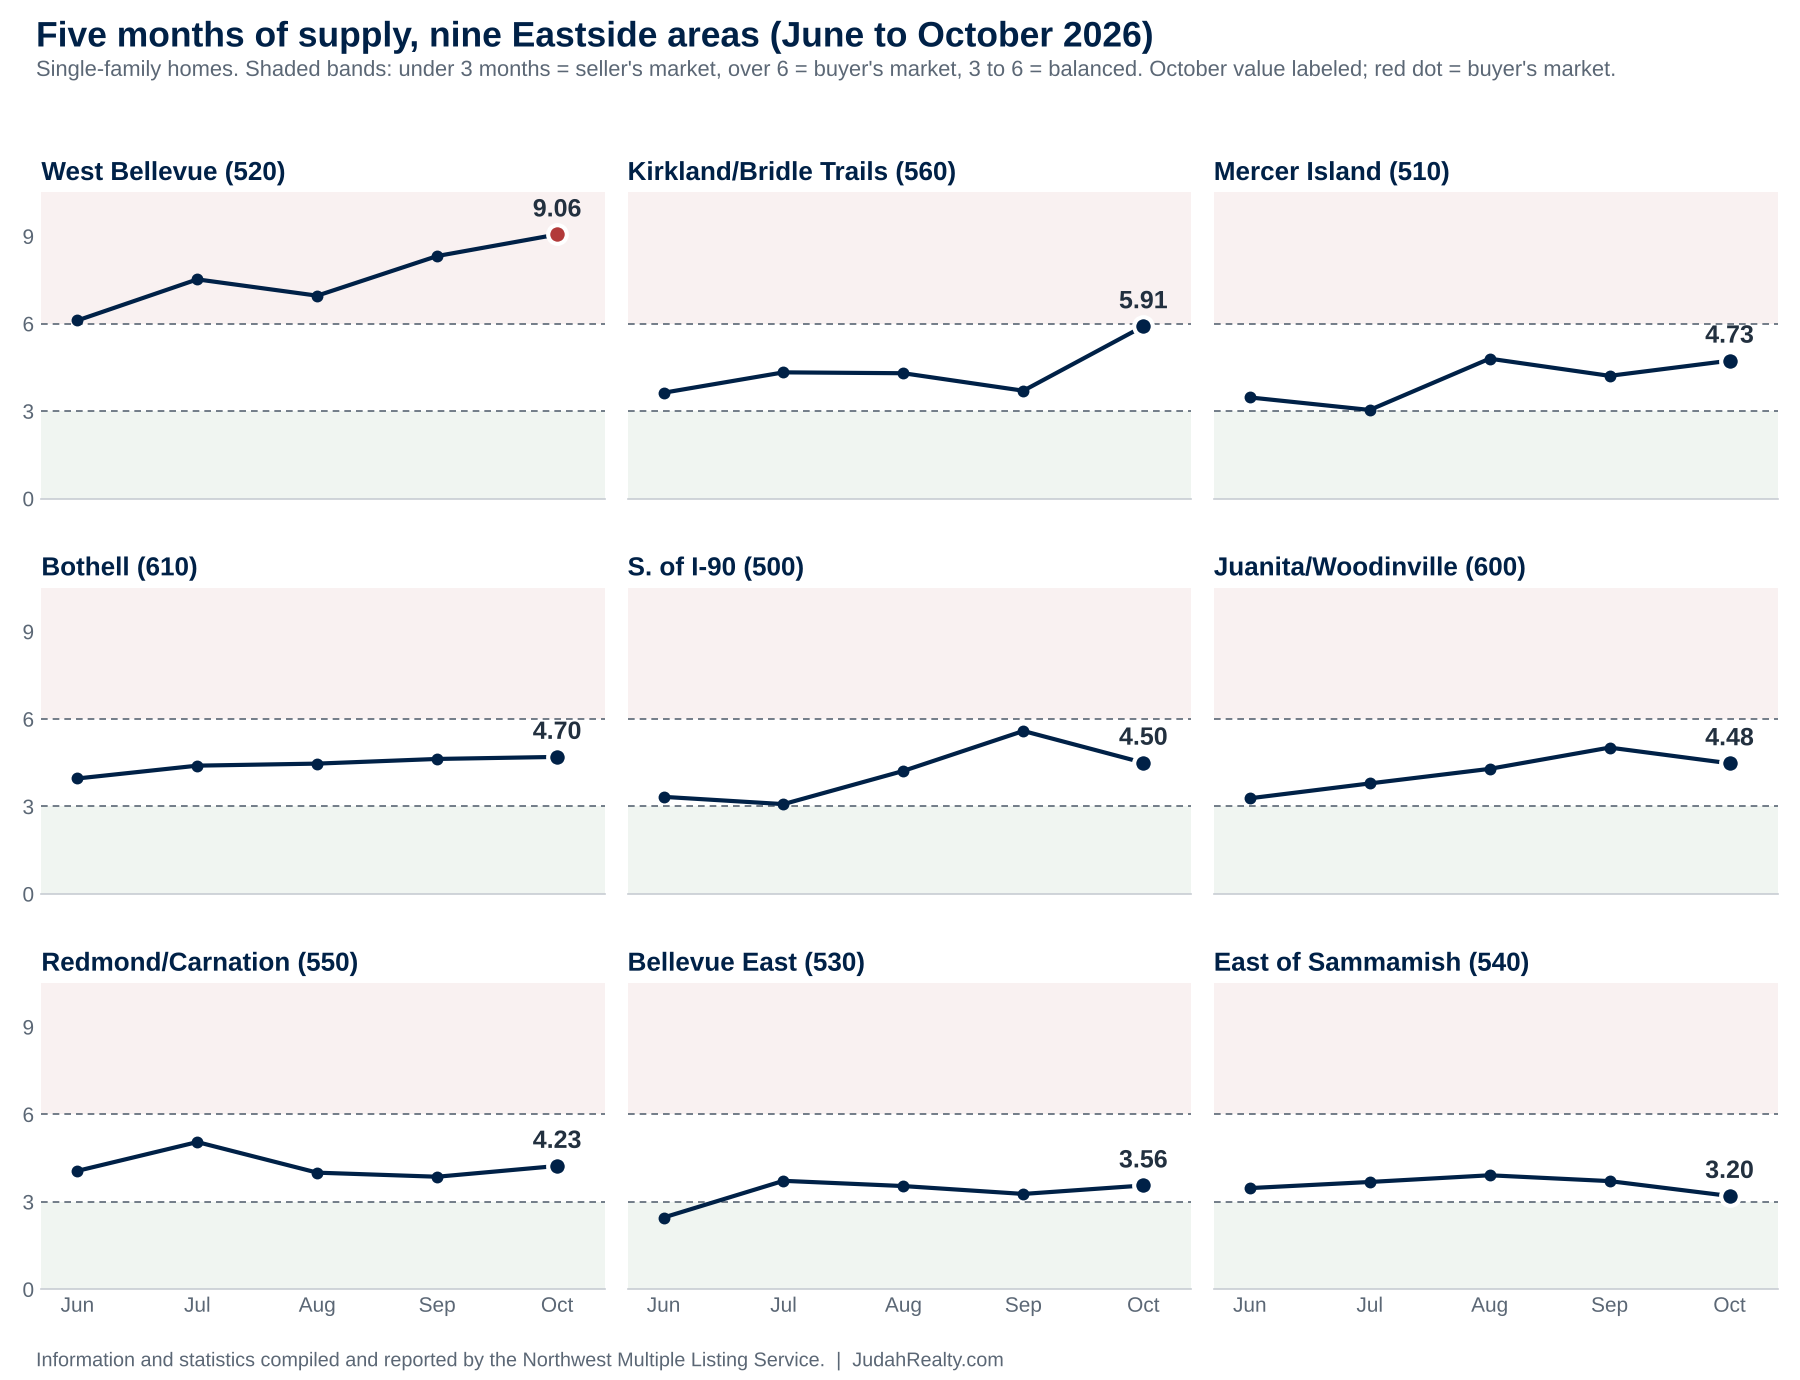
The chart below shows each area from June through October. Months of supply means how long current listings would last at the current pace of sales. This series uses under 3 months for a seller's market, 3 to 6 for balanced and over 6 for a buyer's market.
City-by-City Breakdown
| NWMLS area | Oct months of supply | Sep | Market | Active (vs. Oct 2025) | Pending (vs. Oct 2025) | Median sale price (vs. Oct 2025) |
|---|---|---|---|---|---|---|
| West Bellevue (520) | 9.06 | 8.32 | Buyer's | 145 (+42.2%) | 19 (+26.7%) | $3,426,090 (+5.4%) |
| Kirkland/Bridle Trails (560) | 5.91 | 3.70 | Balanced | 207 (+27.0%) | 50 (−21.9%) | $1,850,000 (−10.7%) |
| Mercer Island (510) | 4.73 | 4.21 | Balanced | 71 (+61.4%) | 20 (+25.0%) | $2,650,000 (+0.8%) |
| Bothell (610) | 4.70 | 4.63 | Balanced | 385 (+48.6%) | 78 (−29.7%) | $962,500 (−9.6%) |
| S. of I-90 (500) | 4.50 | 5.59 | Balanced | 216 (+46.9%) | 55 (−14.1%) | $1,489,997 (−5.7%) |
| Juanita/Woodinville (600) | 4.48 | 5.02 | Balanced | 444 (+53.1%) | 89 (−14.4%) | $1,100,000 (−10.6%) |
| Redmond/Carnation (550) | 4.23 | 3.86 | Balanced | 169 (+33.1%) | 36 (−32.1%) | $1,180,000 (−21.3%) |
| Bellevue East (530) | 3.56 | 3.27 | Balanced | 160 (+53.8%) | 35 (−43.5%) | $1,525,000 (−5.9%) |
| East of Sammamish (540) | 3.20 | 3.71 | Balanced | 352 (+64.5%) | 92 (+4.5%) | $1,325,000 (−5.7%) |
Medians in a single month can swing with the handful of homes that happened to close, especially in areas with few sales. West Bellevue's median, for example, is based on 16 closings, so use it as a signal, not a price guide.
What Each Area Is Telling Us
- West Bellevue (520): the only buyer's market, at 9.06 months. It has been above 6 months in all five months of this series. Pending sales were up from a year earlier, but on small numbers, 19 compared with 15.
- Kirkland/Bridle Trails (560): the biggest move this month, from 3.70 to 5.91 months, just under the buyer's market line. Only 35 homes closed against 207 active listings.
- Mercer Island (510) and Bothell (610): both edged up, to 4.73 and 4.70 months. Mercer Island pending sales were up 25.0% from a year earlier.
- S. of I-90 (500) and Juanita/Woodinville (600): both eased after rising in September, to 4.50 and 4.48 months.
- Redmond/Carnation (550): rose to 4.23 months, with pending sales down 32.1%. Most October activity happened before Microsoft's October 26 announcement, so this data cannot show any effect from it. Here is what that news does and doesn't mean.
- Bellevue East (530): 3.56 months, still one of the tightest areas, even with pending sales down 43.5% from a year earlier.
- East of Sammamish (540): the tightest area at 3.20 months, and one of only three areas where pending sales rose from a year earlier.
Condos Remain Softer Than Houses
Across the NWMLS service area, the condo median fell 13.0% to $435,000, the lowest since February 2023, with 6.59 months of inventory compared with 4.14 for single-family homes. In King County, condos had 7.0 months of inventory, and the median fell 15.5% to $465,000. I covered what that means for buyers and sellers in Condos #1: Eastside Condo Market.
What This Means for Sellers
- Price to today's competition. Active listings were higher than a year ago in all nine areas. Buyers can compare more homes, so price to current closed sales and active listings, not last spring's results.
- Know your area's number. A seller in East of Sammamish (3.20 months) faces a different market than one in West Bellevue (9.06 months).
- Start with a current value. Request a free Eastside home valuation built on current NWMLS sales in your area.
- Plan for a longer timeline. With fewer homes going under contract, build extra time into your moving and financing plans.
What This Means for Buyers
- Use the extra choice. With more listings and fewer contracts, you often have more time to compare homes and ask questions before you commit.
- Negotiate on more than price. Repairs, closing costs and timing can all be part of an offer, especially in areas with higher supply.
- Run the payment first. At 7.18%, a lender's payment review shows what each price costs per month before you fall for a home.
- Still expect competition for the right home. Even in a balanced market, well-priced homes in tight areas can draw multiple buyers.
You can see how I help on both sides on my Eastside buyer and seller services page, and in my Q3 2026 Eastside luxury market report.
Frequently Asked Questions
What does the October 2026 NWMLS data say about the Eastside housing market?
Across nine Eastside areas, active single-family listings rose 48.2% from a year earlier, from 1,450 to 2,149, while pending sales fell 17.9%, from 577 to 474. Combined months of supply was 4.39, nearly unchanged from 4.40 in September.
Is the Eastside a buyer's market or a seller's market right now?
Mostly balanced. Eight of nine Eastside areas had between 3 and 6 months of supply in October 2026. West Bellevue was the only buyer's market at 9.06 months, and no area was under 3 months, the seller's market range.
Which Eastside areas have the most inventory in October 2026?
West Bellevue had the most at 9.06 months of supply, followed by Kirkland/Bridle Trails at 5.91, up from 3.70 in September, and Mercer Island at 4.73. The tightest areas were East of Sammamish at 3.20 months and Bellevue East at 3.56.
How are mortgage rates affecting Eastside home sales?
Freddie Mac's 30-year average peaked at 7.40% in the weeks of October 8 and October 15, then eased to 7.18% as of November 5, compared with 6.22% a year earlier. Across the NWMLS service area, October pending sales fell 17.8% from a year earlier, the fewest for any October since at least 2014.
Should I sell my Eastside home now or wait?
It depends on your timeline, finances and area. Sellers are competing with more listings than a year ago in all nine Eastside areas, so pricing to current closed sales and active competition matters more than last spring's results. A current home valuation is the best place to start.
Information and statistics compiled and reported by the Northwest Multiple Listing Service. Area figures are single-family (RES-only) from the NWMLS King and Snohomish County breakout reports for October 2026; nine-area totals and combined months of supply are calculated from those area rows. Regional figures are NWMLS service area totals. Mortgage rates from Freddie Mac's Primary Mortgage Market Survey. This article is for educational purposes and is not financial advice.

500+ Eastside Transactions
CRS · CLHMS · CNE · ABR · SRS · CSP
Built Green · Ninja Selling · WCR Member
425 Magazine & Seattle Times Featured
Bilingual English/Spanish
YOUR EASTSIDE MARKET ADVISOR
Let's Read Your Market Together
Nine areas tell nine different stories this month. I will pull the October NWMLS numbers for your exact neighborhood and show you what they mean for your price and timing.
Whether you are buying, selling or simply planning ahead, you will get clear answers with no pressure.
📞 Call/Text: (425) 941-8688
✉️ freddy@judahrealty.com
🌐 JudahRealty.com
📍 10237 Main Street, Bellevue, WA 98004